Recessions are caused by "shocks" -- events so impactful that they gum up the economic works, grinding activity to a halt. Oil price spikes are a great example; gasoline price hikes have contributed to a majority of recessions since the early 1970s. Financial shocks -- like the Savings and Loan crisis of the late 1980s, the internet bubble of the late 1990s, or the housing crisis that preceded the GFC -- are also good examples. Brexit's March 29th date is beginning to look like the latter. Despite surviving a no-confidence vote earlier this week, UK Prime Minister Theresa May remains between a rock and a hard place. The EU is unwilling to re-negotiate their nearly 600-page agreement with the UK, which won't pass Parliament. May has postponed the vote until January, likely hoping that by then it will pass simply because there won't be enough time to re-open negotiations. It's looking pretty ugly right now.
In response to a weakening economy, the Chinese authorities recently authorized a number of stimulus measures, which include higher infrastructure spending, increased loans, and tax cuts. Unfortunately, according to the latest national numbers, those measures aren't panning out as planned. While retail sales increased 8.1% Y/Y, the overall trend for this economic sector continues lower: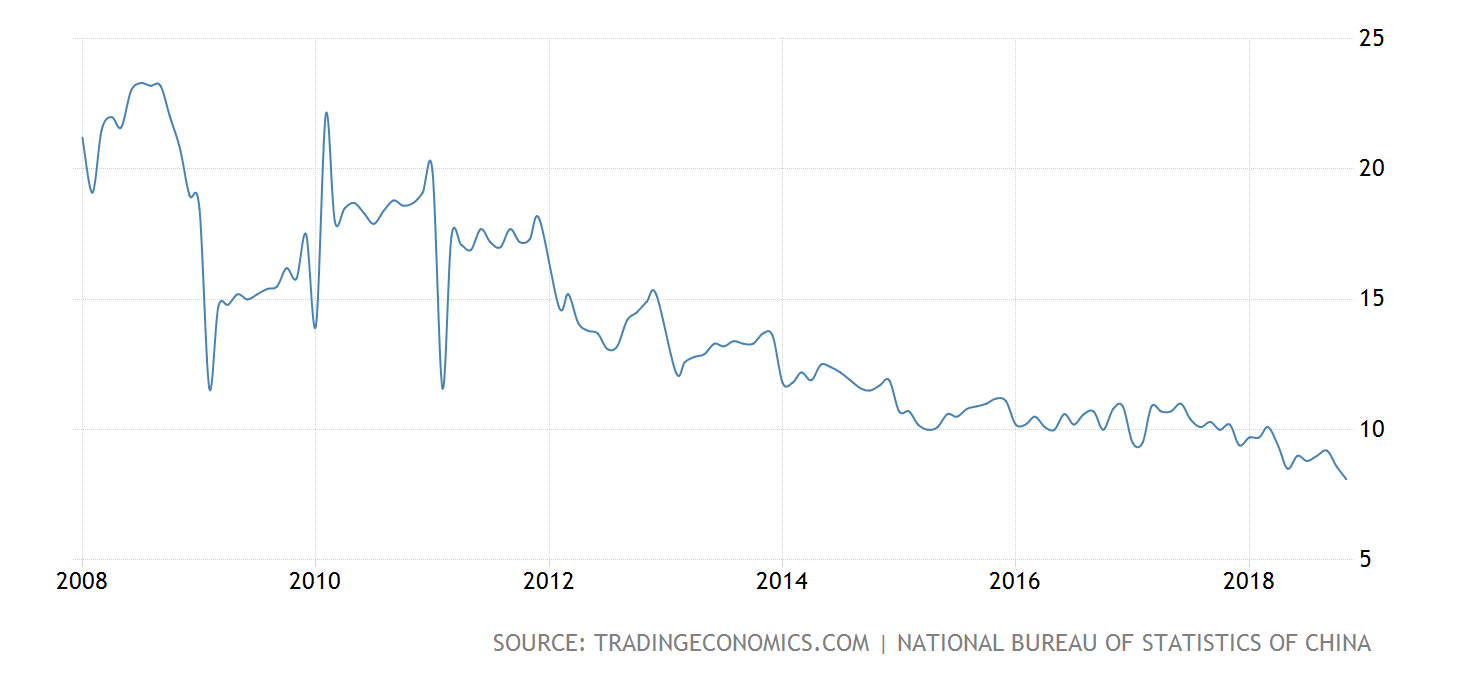
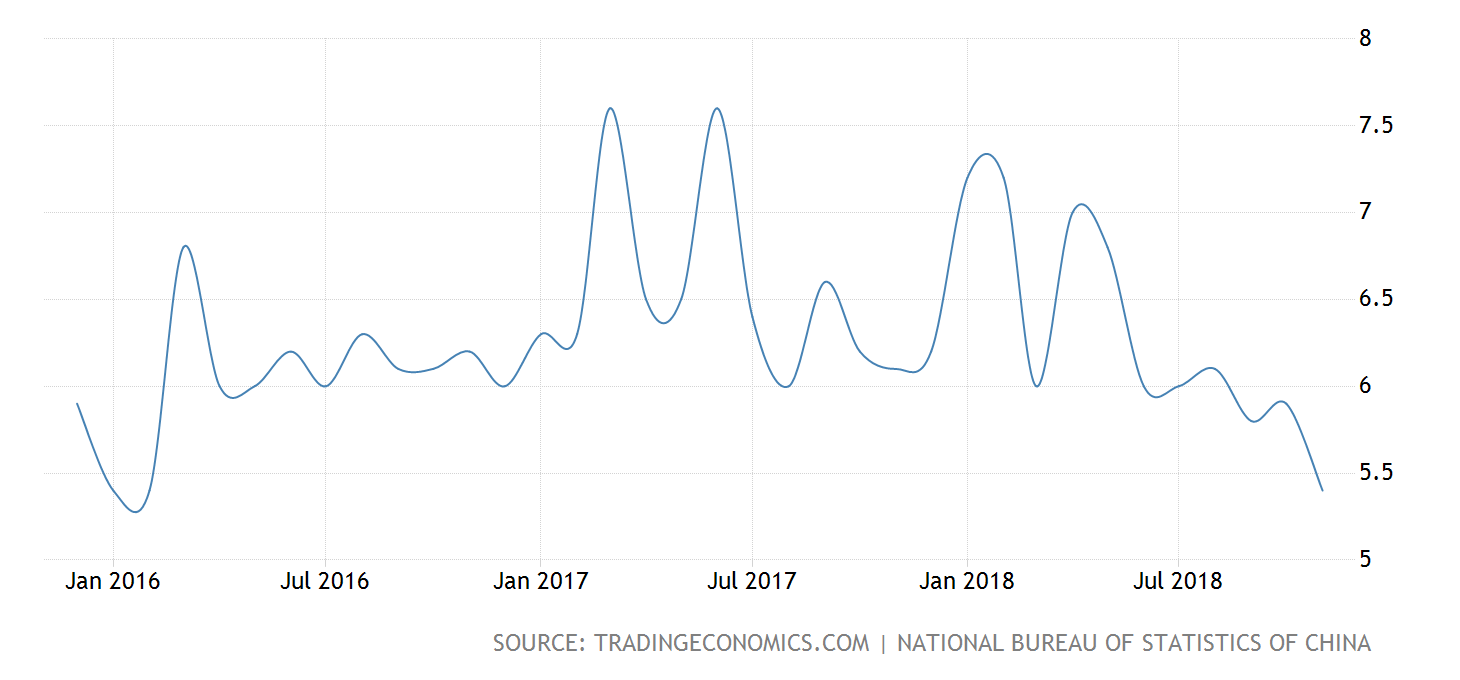
Retail sales aren't the only coincidental data moving lower; so is industrial production:
Lurking in the background is the Chinese debt issue. Although it has yet to meaningfully impact the Chinese economy, that could change if the mainland experienced a slowdown that forced consumers and businesses to reallocate an increasing amount of consumption and investment spending to interest and principal payments.
U.S. coincidental data remains positive. The Census reported that retail sales were up .2% M/M and 4.2% Y/Y; those numbers ex-auto were .2% and 4.9%, respectively. Furniture sales advanced 1.2%, while electronics purchases rose 1.4%. Industrial production increased .6%. The internals, however, were somewhat less impressive. Manufacturing was flat. Mining increased 1.7%, while utility output rose 3.3%.
Let's turn to the performance tables:
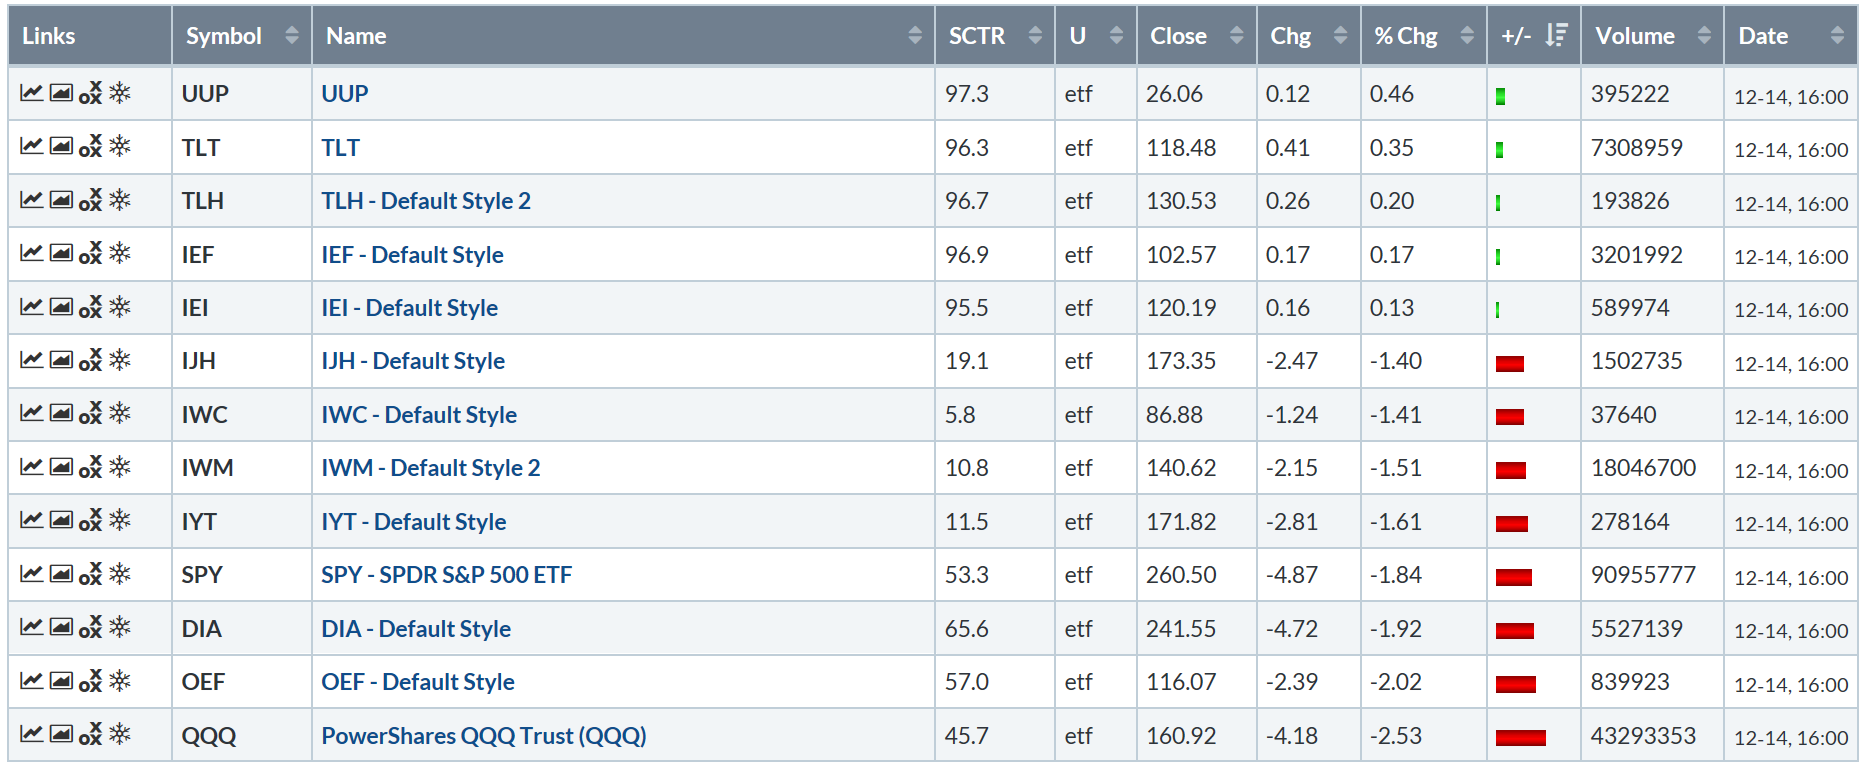
Ideally, you'd like to end the week on a high note. That didn't happen today. The indexes were off pretty sharply. Interestingly, the larger cap indexes were the worst performers, but the smaller-cap indexes were down over 1% as well.
There's a similar pattern in the weekly performance table:
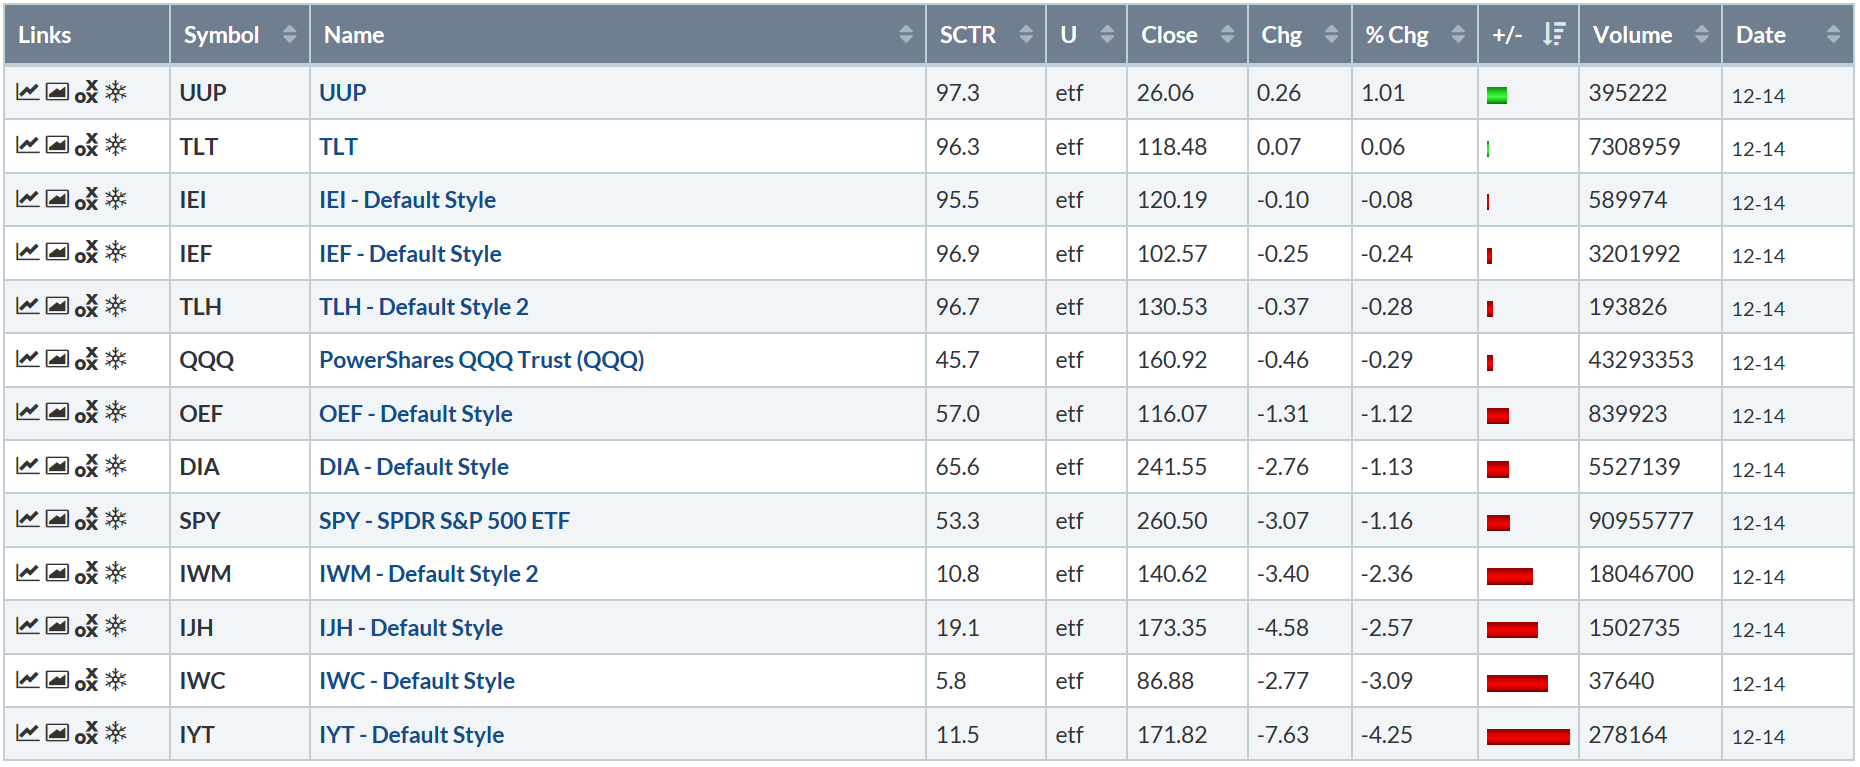
Here, the transports were off over 4, while the smaller-cap indexes were down 3%. The SPY (NYSE:SPY) declined slightly over 1%.
Earlier this week, I noted that the smaller cap indexes were the real key to the market. At the time of that writing, the IWM (NYSE:IWM) was hanging on by a technical thread. Unfortunately, it's continuing to fall. We're also seeing weakness across multiple time frames. Let's start with the 5-day chart:
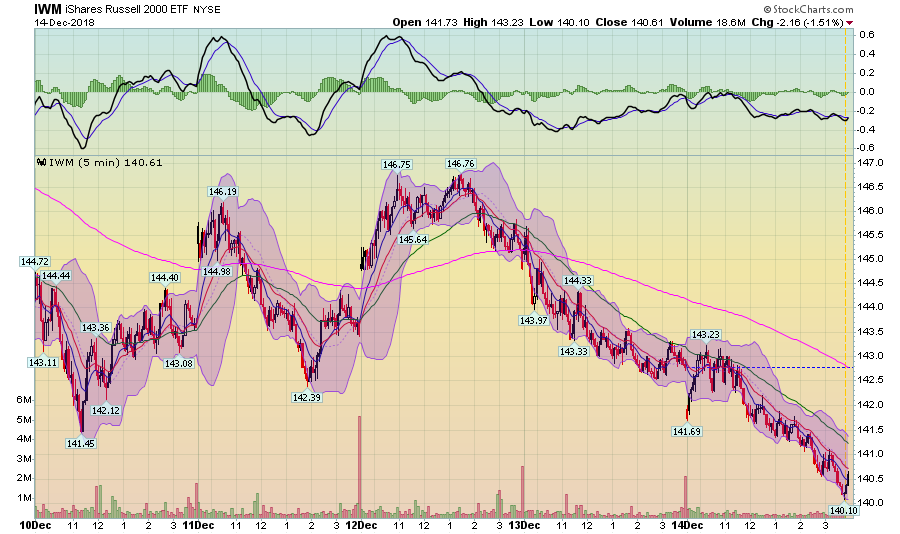
The IWM started to move lower mid-day on Wednesday. It continued to move lower, printing a series of lower lows and lower highs. Prices used the shorter EMA for technical resistance and ended the week just off its low.
There's also bearishness on the 30-day chart:
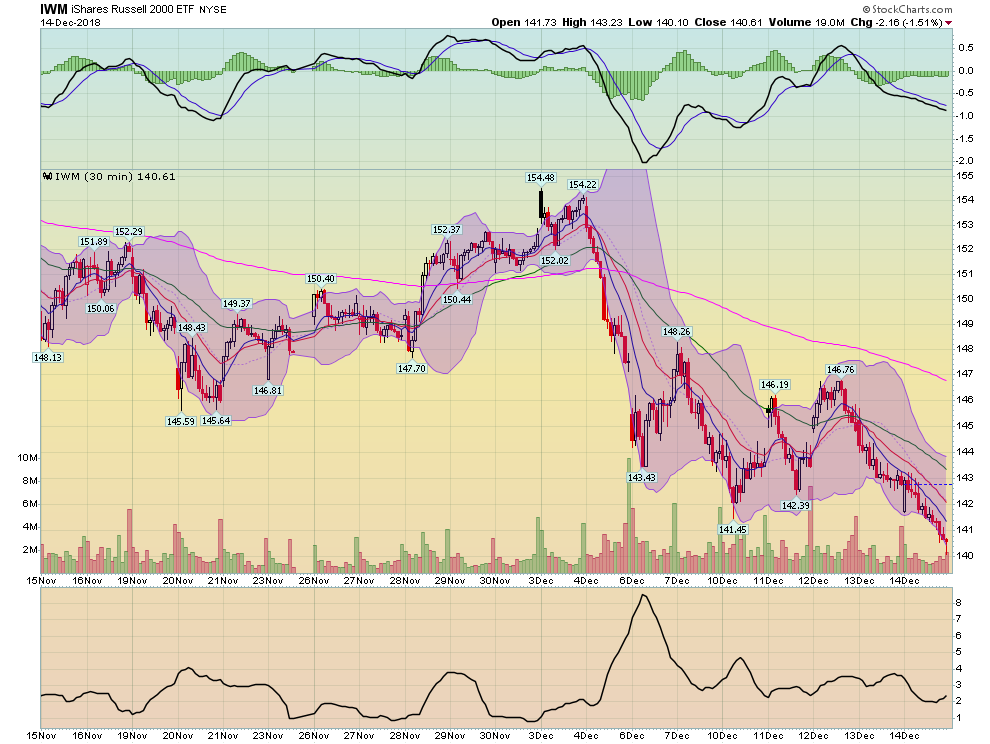
Prices declined from 154 to 143 -- a 7% drop -- on December 4 and 5. They consolidated losses between December 6-12, but then continued lower.
And then we have the daily chart:
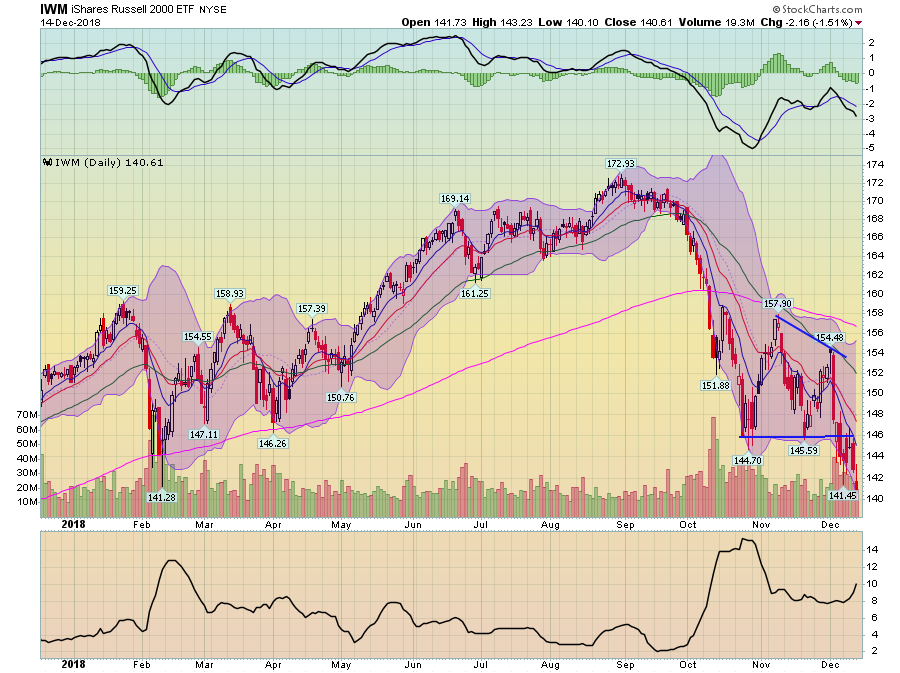
Prices have broken through support and are now at a 52-week low. All the EMAs are moving lower with the shorter below the longer.
This flight of risk capital is pulling the SPYs lower:
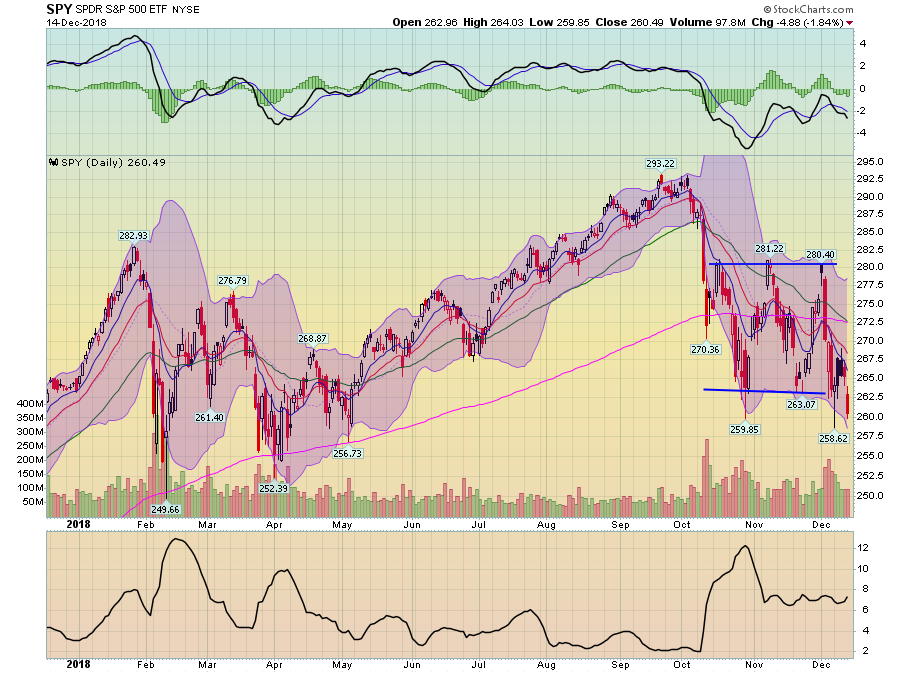
Today, the SPY solidly broke through support and is clearly heading lower. It also looks like the 50-day EMA moved below the 200-day EMA. If that didn't happen today, it will next week.
There is no reason to think we'll see a rally anytime soon; the underlying technicals are building to a selling frenzy.
Disclosure: I/we have no positions in any stocks mentioned, and no plans to initiate any positions within the next 72 hours. I wrote this article myself, and it expresses my own opinions. I am not receiving compensation for it (other than from Seeking Alpha). I have no business relationship with any company whose stock is mentioned in this article.
