Technically Speaking For April 22-26:
Summary
- Emerging market economies are holding up pretty well; the EU is still weak and Asia is still feeling the effect of China's recent slowdown.
- It's more and more possible that the U.S. has dodged a recession at the end of this year.
- Still, the markets are telling a "slow growth" story.
Key Economic Statistics
- Emerging Market
- Brazil business confidence falls to 61.9
- Brazil payrolls drop 43,000
- Turkish consumer confidence increases 4.1 points to 63.5
- Turkish business confidence up
- Turkish capacity utilization up .7 to 75%
- Mexican unemployment at 3.6%
- Mexican retail sales up 1.8% Y/Y
- South African consumer confidence decreases to 2
Emerging market conclusion: these countries are holding up fairly well. Despite some weak numbers, Brazil is still growing. And there is hope that, despite some lapses in judgment, the new president will work to change key problems in the economy. Turkish sentiment and capacity utilization increased; Mexican growth is modest.
- Asia/Japan/Austalia
- Australian CPI 0% M/M; 1.3% Y/Y
- Japanese Coincident indicator up 2.8; leading index up .8 to 97.1
- Japanese retail sales up .2% Y/Y
- Japanese Industrial production down 4.6% Y/Y
- Japanese CPI up .5% Y/Y
- Japanese unemployment 2.5%.
- South Korean economy contracts .2%
Asian conclusion: we're still seeing weakness in countries peripheral to China. South Korean exports contracted in the 1Q; Japanese industrial production was off sharply. Both these numbers were partially caused by Chinese weakness. Assuming a 3-6 month delay between China's policy changes and its trading partners, we should see an increase in peripheral countries numbers by mid-summer.
- Europe
- German business confidence is down modestly
- French business confidence is off modestly.
US Data Of Note
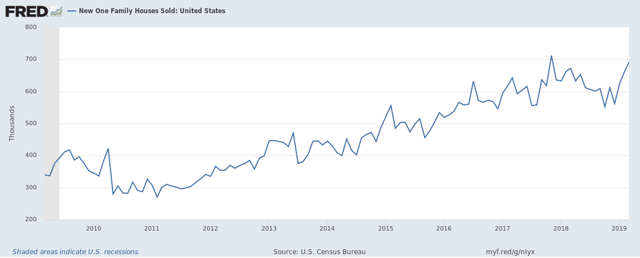
This week, we have mixed data on the U.S. housing market. New homes sales rose to near a cycle high (emphasis added):
Sales of new single‐family houses in March 2019 were at a seasonally adjusted annual rate of 692,000, according to estimates released jointly today by the U.S. Census Bureau and the Department of Housing and Urban Development. This is 4.5 percent (±17.6 percent)* above the revised February rate of 662,000 and is 3.0 percent (±11.4 percent)* above the March 2018 estimate of 672,000.
Here's a chart of the data:

Higher rates caused a modest decline in 2018. My guess is that lower rates (15 and 30-year mortgage rates are down about 80 (0.8%) in the last few months) are having a stimulative impact. However, existing home sales were off (emphasis added):
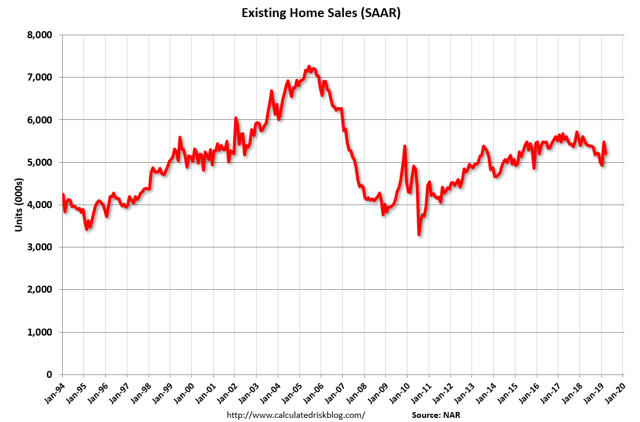
Total existing-home sales1, completed transactions that include single-family homes, townhomes, condominiums and co-ops, fell 4.9% from February to a seasonally adjusted annual rate of 5.21 million in March. Sales as a whole are down 5.4% from a year ago (5.51 million in March 2018).
Here's a chart of the data:

This graph has a similar pattern as new homes sales: a modest decline in 2018 but a solid rebound recently, probably due to lower mortgage rates.
My conclusion is that the data is softer as a result of the Fed's interest rate increases. But, the softer data isn't fatal.
New orders for durable goods were up (emphasis added):
New orders for manufactured durable goods in March increased $6.8 billion or 2.7 percent to $258.5 billion, the U.S. Census Bureau announced today. This increase, up four of the last five months, followed a 1.1 percent February decrease. Excluding transportation, new orders increased 0.4 percent. Excluding defense, new orders increased 2.3 percent. Transportation equipment, also up four of the last five months, led the increase, $6.1 billion or 7.0 percent to $93.8 billion.
Non-defense capital goods ex-aircraft rose 1.3% - a decent indicator of business investment sentiment.
GDP data was odd. Here's how I characterized it in my Turning Points Newsletter (emphasis added).
If the "guts" of the report [PCEs and investment spending] were a bit strange, what accounts for the large top-line increase? For starters, state and local government spending rose 3.9%, probably to compensate for the government shutdown. That's the biggest increase since 1Q16. Imports declined by 3.7%, which is the largest decline in the last four years. I think the better numbers to use are either final sale to domestic purchasers (+2.3%) or gross domestic purchases (+2.7%). Still, either is better than the very weak 1Q readings we've seen for most of this expansion.
US Conclusion: a decent argument can be made that despite the yield curve's recent inversion, we've come pretty close to dodging a recession. Housing is soft but should be supported by a dovish Fed. Durable goods orders were solid; business spending picked up. And despite its odd composition, domestic demand is held-up in the 1Q19.
Central Bank Actions of Note
The Bank of Canada maintained rates at 1.75%. Their policy announcement made two key observations (emphasis added).
Global economic growth has slowed by more than the Bank forecast in its January Monetary Policy Report (MPR). Ongoing uncertainty related to trade conflicts has undermined business sentiment and activity, contributing to a synchronous slowdown across many countries. In response, many central banks have signalled a slower pace of monetary policy normalization. Financial conditions and market sentiment have improved as a result, pushing up prices for oil and other commodities.
Global trade tensions are continuing to negatively impact sentiment, which is slowing growth. Central banks have become more dovish, which has created more supportive financial conditions - global interest rates are lower and equity prices are higher.
As for Canada, the bank is projecting lower growth (emphasis added):
In Canada, growth during the first half of 2019 is now expected to be slower than was anticipated in January. Last year’s oil price decline and ongoing transportation constraints have curbed investment and exports in the energy sector. Investment and exports outside the energy sector, meanwhile, have been negatively affected by trade policy uncertainty and the global slowdown. Weaker-than-anticipated housing and consumption also contributed to slower growth.
Like parts of the U.S., fracking has created a new mining industry in Canada. Energy extraction has become so large that oil's price drop a few years sent the Canadian economy into a modest recession. This explains why the BOC talks about energy and non-energy business. Weak business sentiment in both sectors is negatively impacting domestic growth.
The Bank of Japan maintained its current interest rate and bond-buying program at its latest meeting. They also added this policy clarification (emphasis added):
The Bank intends to maintain the current extremely low levels of short- and long-term interest rates for an extended period of time, at least through around spring 2020, taking into account uncertainties regarding economic activity and prices including developments in overseas economies and the effects of the scheduled consumption tax hike.
The BOJ has joined the Fed and ECB in the more dovish policy camp. We can also include the Bank of China - which has been stimulating the economy over the last 6 months - to the list.
Central Bank Conclusion: the dovish tone of central banks continues. The BOC sees weak growth internationally and domestically. While the BOJ didn't mention where growth was weak, the chances are very high that they think Chinese weakness has slowed the domestic Japanese economy.
Markets Overview
Looking at the combined picture of the Treasury and equity markets, we're still seeing a "slow growth" scenario.
Let's start with the 6-month charts of the Treasuries.

All sections of the curve are at high levels. You can make an argument that each chart is either in a long-term uptrend or consolidating sideways. 
The two-month charts show that the Treasury market ETFs have been rallying all week; it wasn't just the weak internals of today's GDP report that sent them higher.
Treasuries rally when fixed-income investors see little to no inflation, which is another way of saying slow growth.
And then we have the equity indexes:

Larger-cap indexes QQQ, bottom left; SPY, bottom right; OEF, top right) are in the middle of strong rallies. Mid-caps (top left) are moving higher but their upward trajectory is weaker. Small and micro-caps (top middle) remain below recent highs. As the size of the company decreases the more difficult a rally becomes. Small companies need faster economic growth while larger companies are able to better withstand slower-growth scenarios.
So, as we end the last full trading week of April, we remain where we've been for some time: the markets are saying, "growth will be positive but weak".
Disclosure: I/we have no positions in any stocks mentioned, and no plans to initiate any positions within the next 72 hours. I wrote this article myself, and it expresses my own opinions. I am not receiving compensation for it (other than from Seeking Alpha). I have no business relationship with any company whose stock is mentioned in this article.
