In this edition of “Technically Speaking” we analyze the 15-bullish beliefs (or not) currently supporting the market. Is this time different? Or should investors be concerned?
Bullish Moves
Yesterday, the market broke out of its consolidation range that we have been discussing over the past several weeks. Such is undeniably bullish and sets the market up for a test of “all-time” highs.
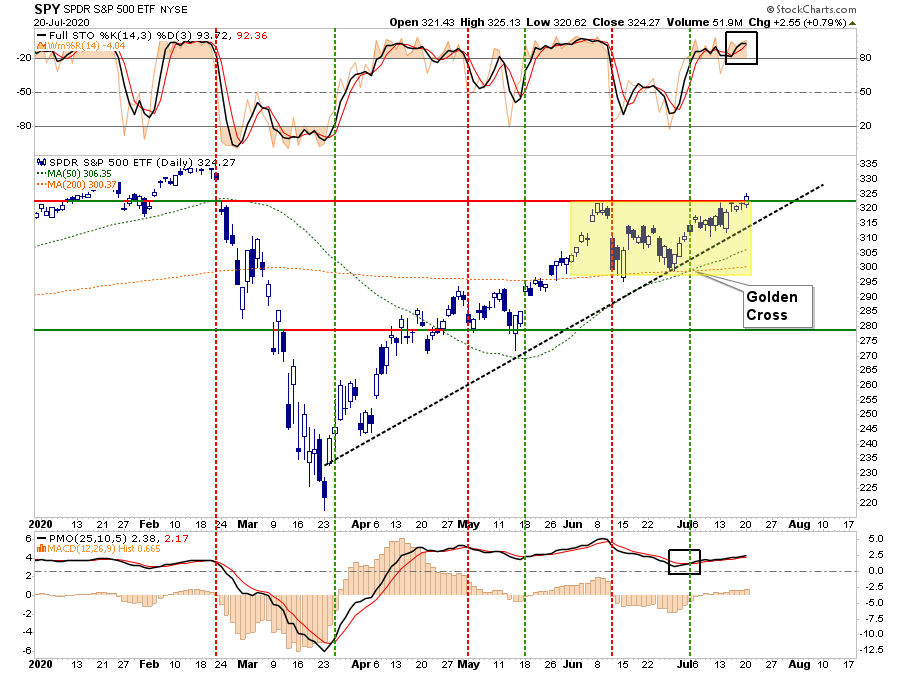
However, while we did get a bit of “exuberance” yesterday, there was still considerable weakness beneath the overall market. As noted this weekend, the month of July has continued to perform as expected and has provided the seasonal lift to stocks.
“In the short-term, the bulls remain in charge currently, and as such, we must be mindful of those trends. Also, the month of July tends to be one of the better performing months of the year.”
Seasonal Weakness
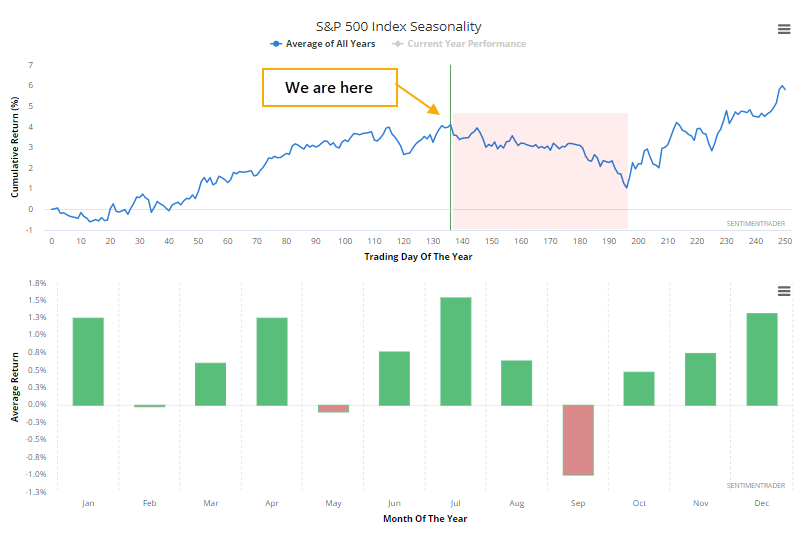
However, as noted by SentimenTrader, the markets are about to enter the seasonally “weak,” two months of the year.
“According to Morgan Stanley (via the WSJ), stocks are about to enter a seasonally rough stretch. Indeed we are, based on seasonal calendar returns for the S&P 500. Seasonality in stocks is a tertiary factor even at its best and carries very little weight. It’s still a headwind, though.”
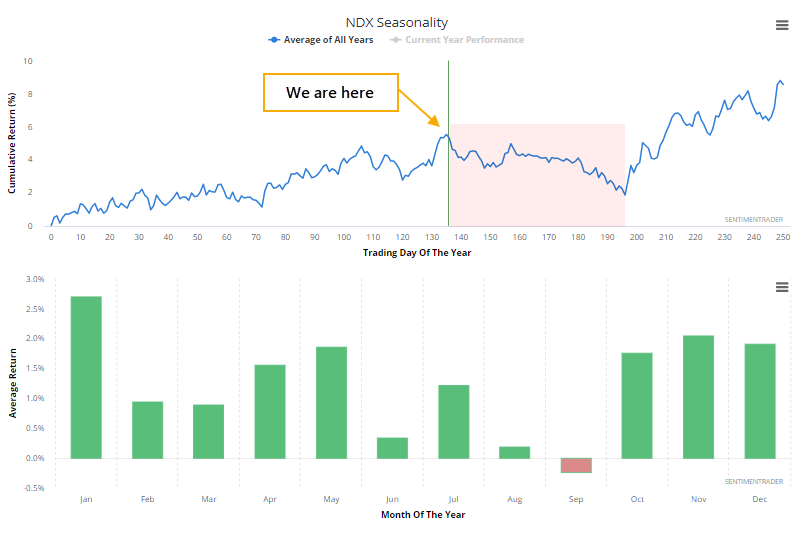
“It’s even worse for indexes like the Nasdaq 100, whose component stocks have helped to drive this rally. The NDX’s seasonal peak is right now.”
“If we use the Morgan Stanley (NYSE:MS) methodology to look at the S&P 500’s forward rolling 2-month returns since 1999, then we can see a similar pattern, with the biggest dip occurring right about now.”
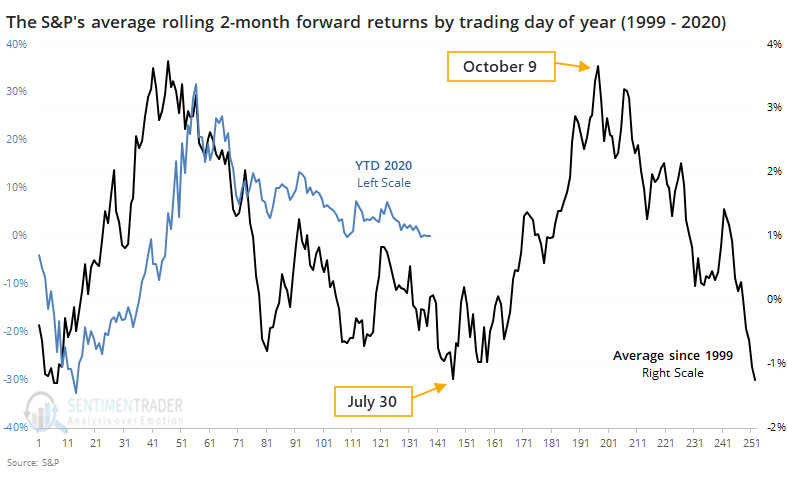
“What the black line on the chart shows us is the S&P’s average two-month return over the next two months for every trading day of the year. We’re at trading day #138 as of Monday, with late July being one of the very few windows where the S&P’s average forward return is more than -1%. Contrast that to early October, when its average two-month return has been more than +3.5%.”
SentimenTrader’s analysis does mean that markets will “absolutely” fall out of bed next month. However, given the size of the run from the March lows, against a backdrop of extremely weak economic data, a “breather” should not be out of the question.
This is also the case, when we analyze the most common “media” arguments for the rally.
15-Bullish Factors (Or Not)
While this list is by no means exhaustive, it does offer many of the most important assumptions currently supporting the market.
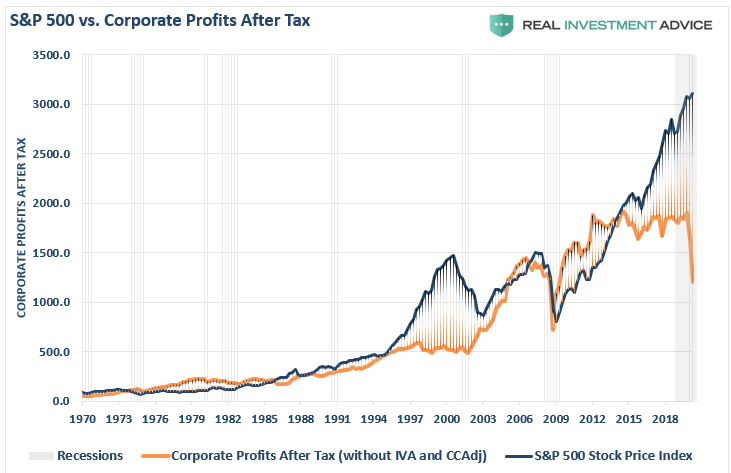
1. Corporate managers have become so adept at their jobs that profit margins and equity valuations will remain at, or rise from current nearly unprecedented levels.
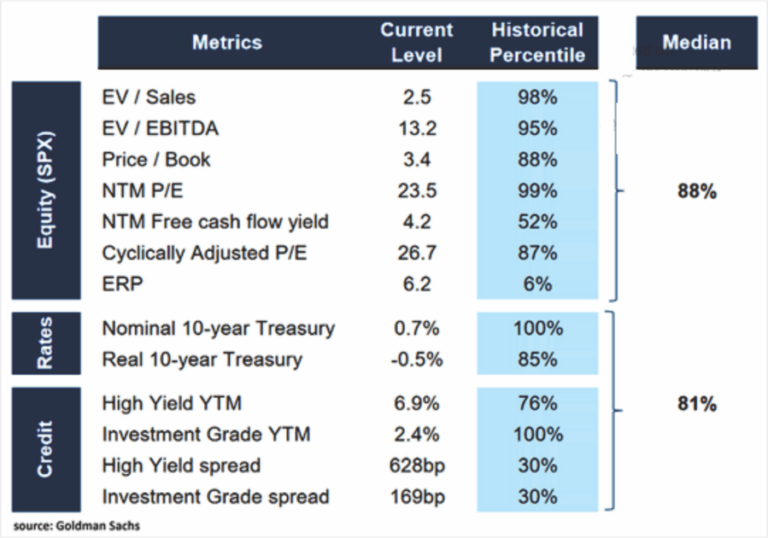
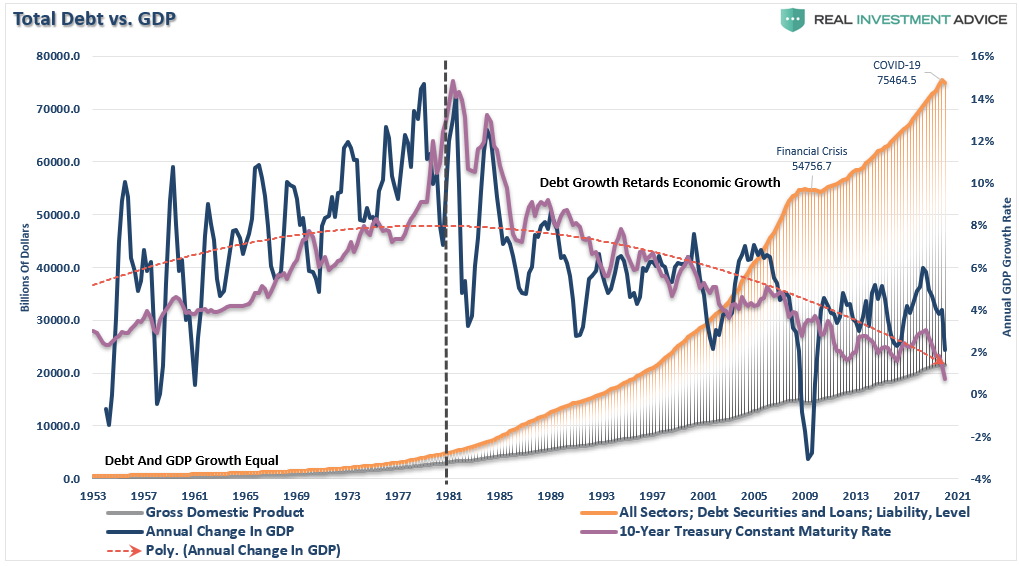
2. Bond yields will rise as economic growth returns, which will support stock prices.
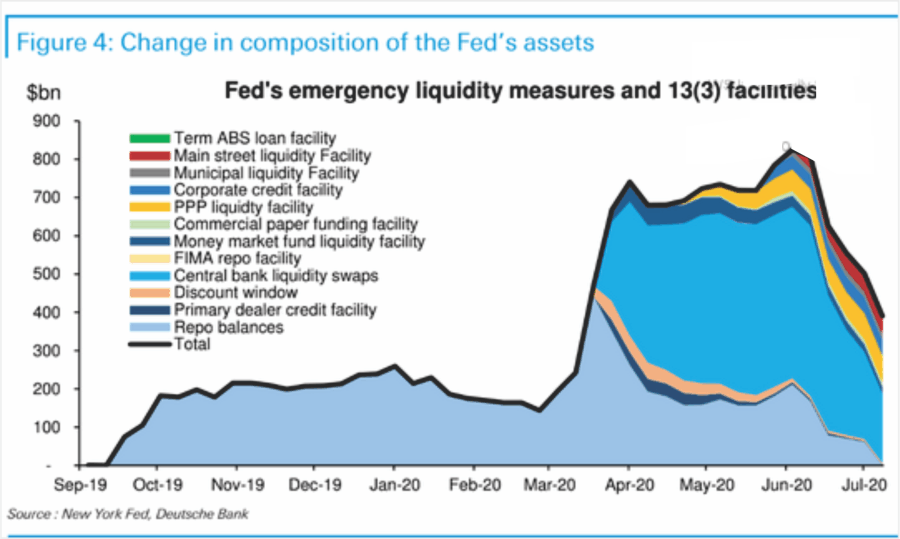
3. The Fed will continue to expand its balance sheet and provide more liquidity.
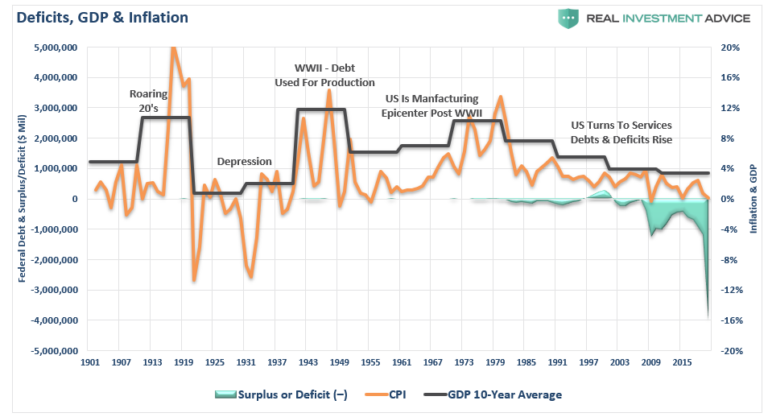
4. Annual fiscal deficits over $1 trillion will power economic growth with no consequences.
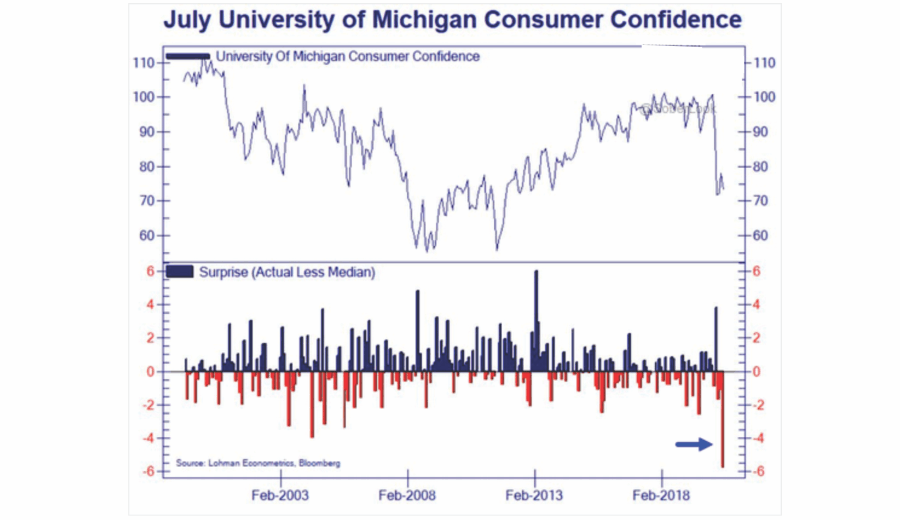
5. The rising number of COVID-19 Cases, when they collide with the annual “Flu” season, will not inhibit consumers from getting back into the economy.
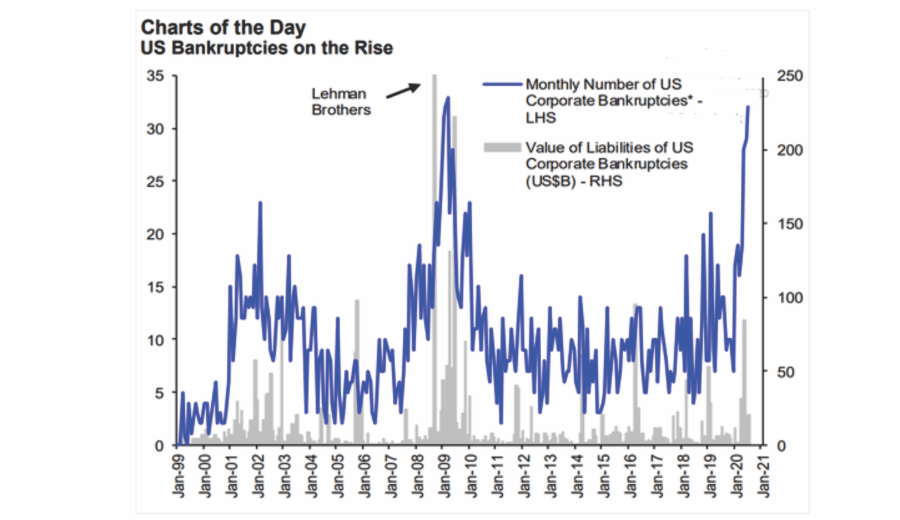
6. The rising number of corporate bankruptcies is a “non-event” due to the Fed.
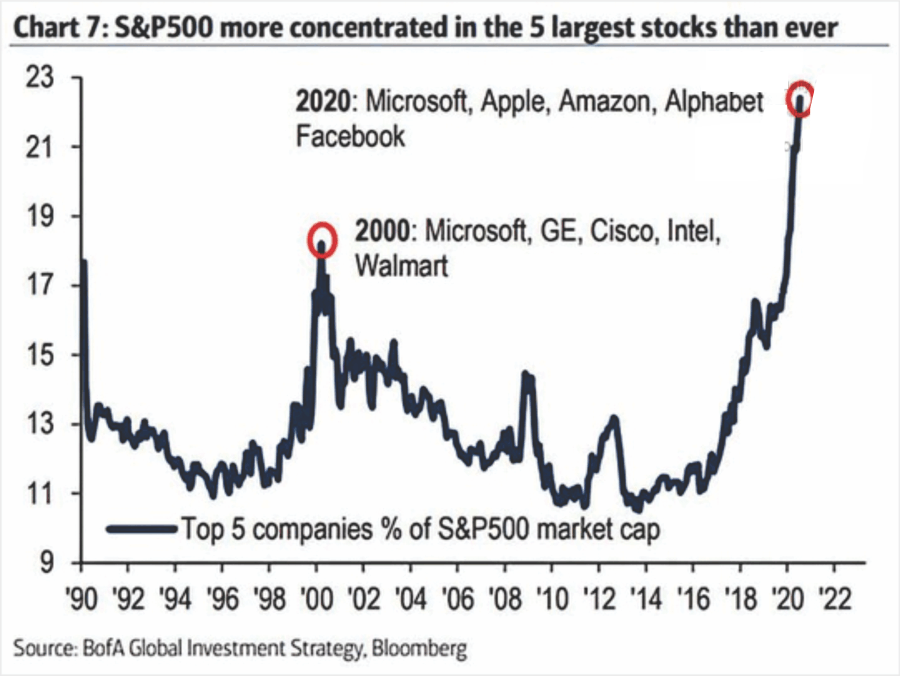
7. Technology companies are the best place to invest now and going forward as they can continue to grow earnings.
8. The resurgence of the U.S./China trade war won’t have any impact on the economy or markets.
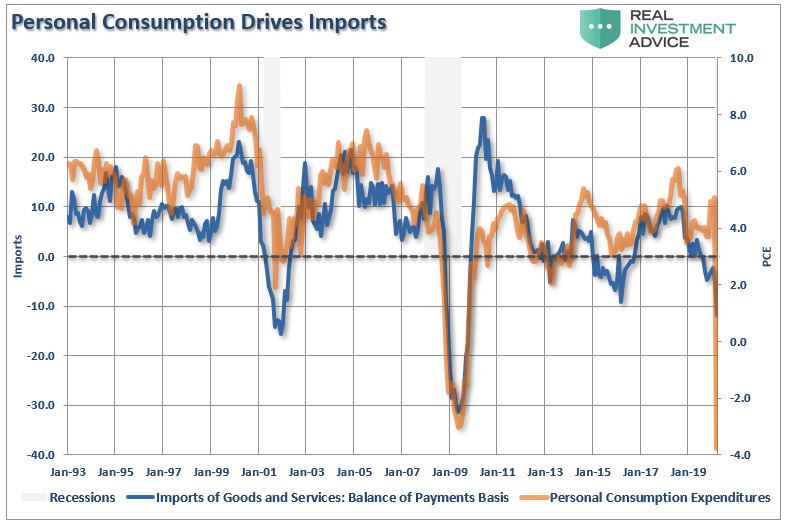
Exports, which comprise roughly 40% of corporate profits, also have a high correlation to consumption and related economic activity.
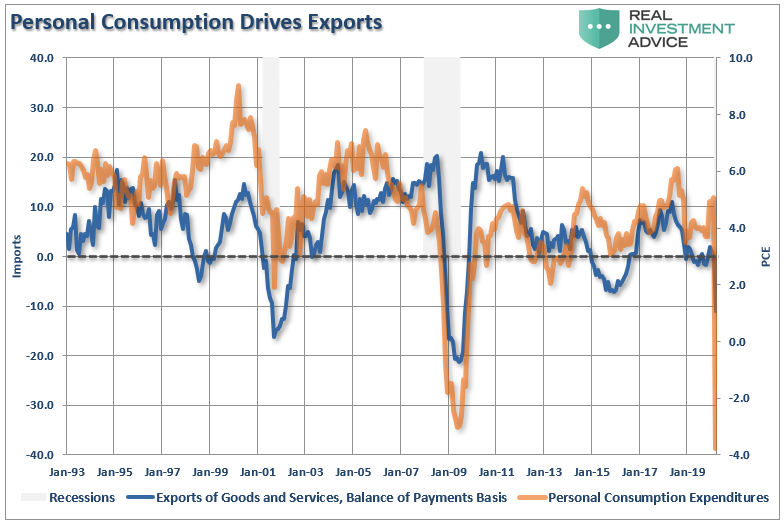
9. Corporations, via stock buybacks, will continue to be the predominant purchaser of US stocks.
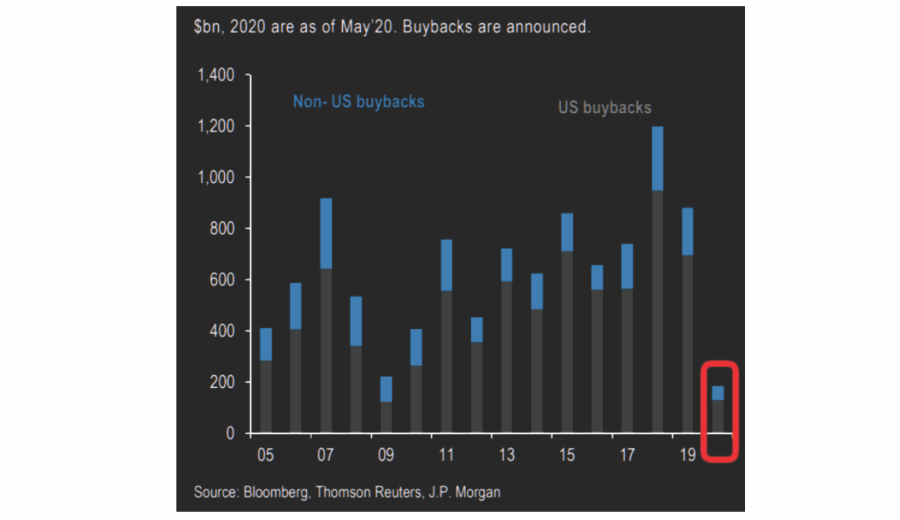
10. Liquidity flows to the financial markets are never going to stop.
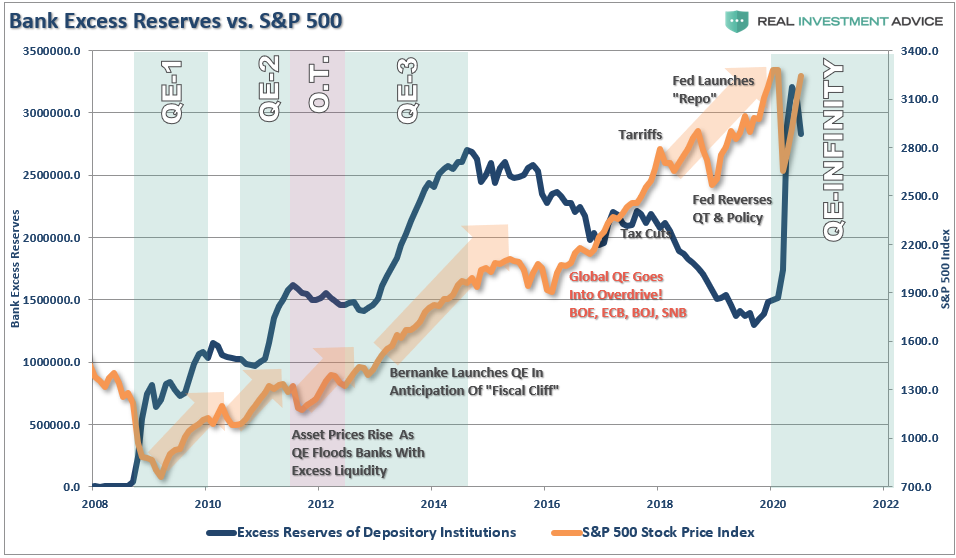
11. Central Banks can permanently prop up asset prices.
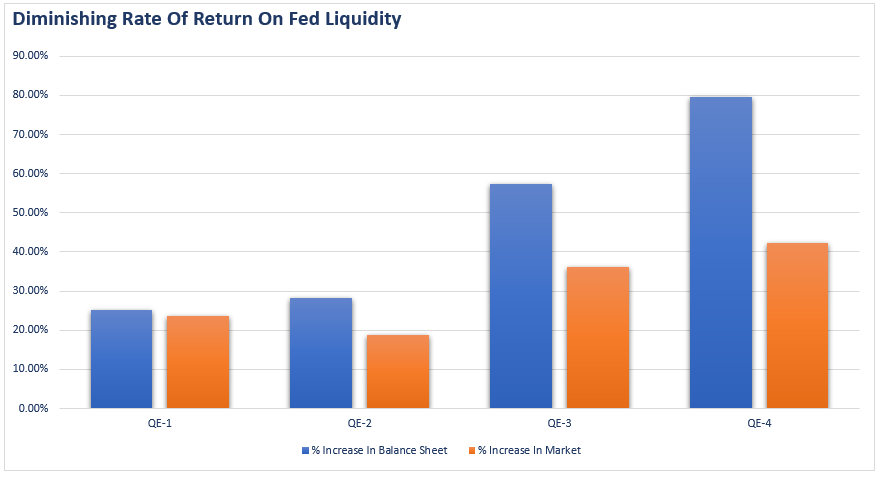
12. Valuations don’t matter. Just the Fed.
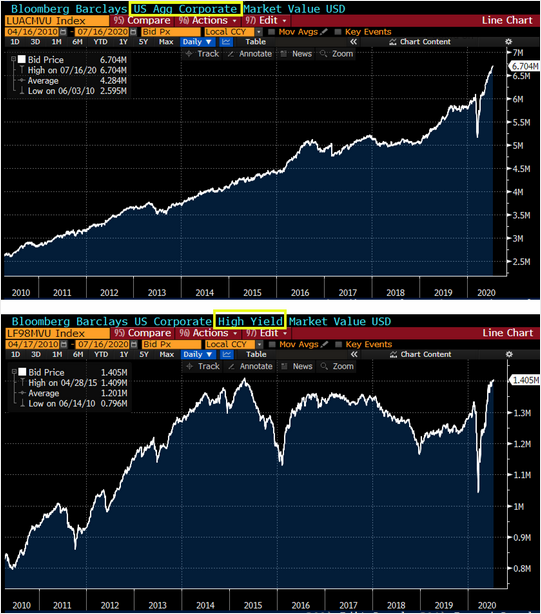
13. Corporations are issuing debt at cheap rates, which will be a good thing long-term.
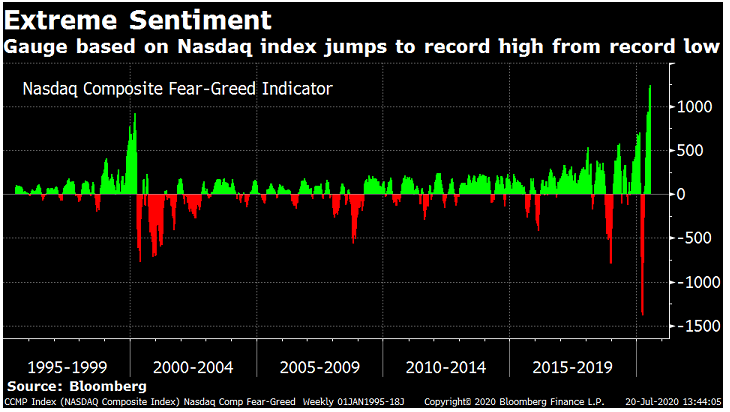
14. The stock market is a can’t lose situation. Buy stocks as they always go up.
And…The most important factor bulls must assume to be true:
15. This time is different
