EUR/USD
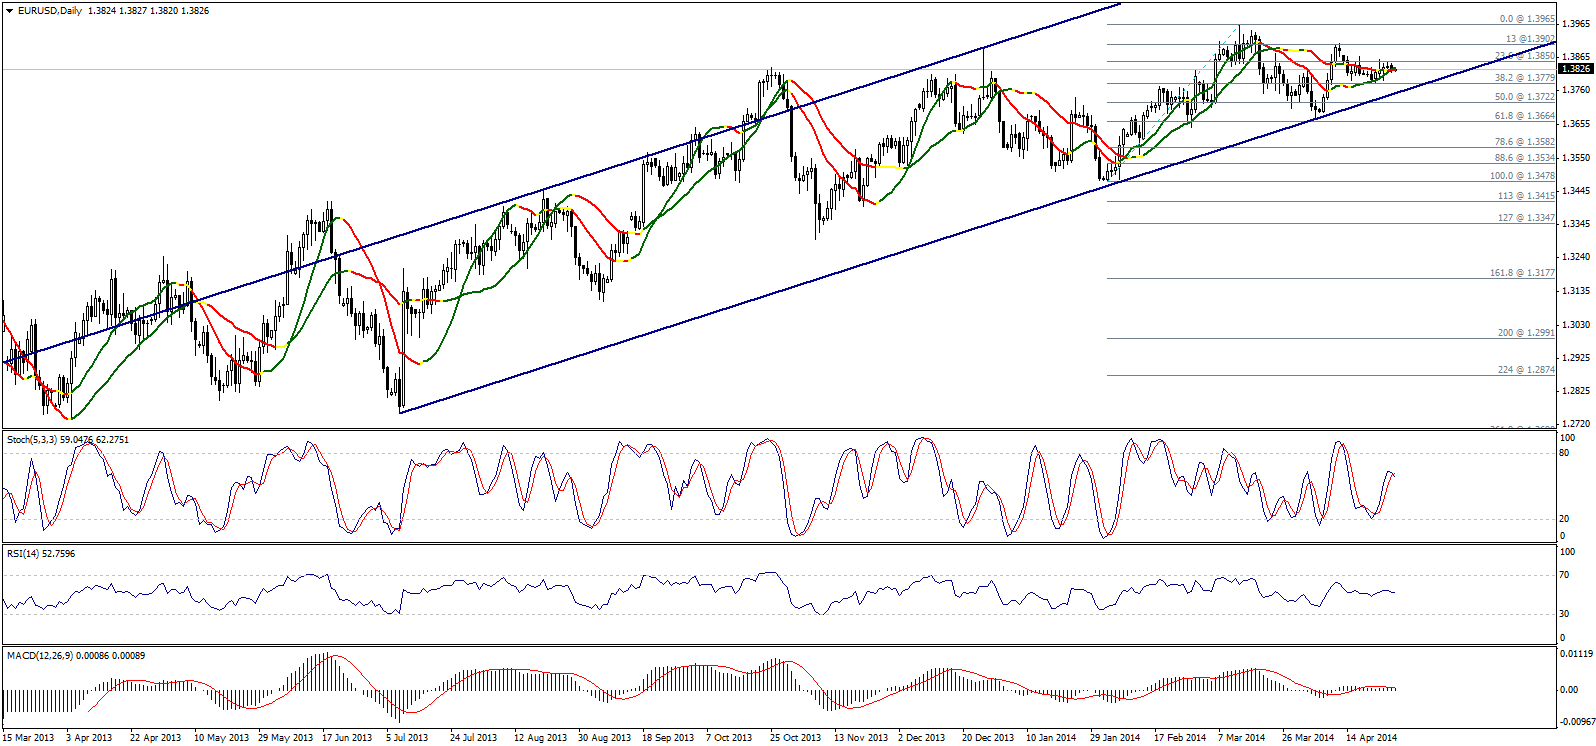
The bullish attempts failed last week due to failing to stabilize above the resistance level 1.3850. Stability above the referred to level is significant to keep the positive possibility, whereas Stochastic is showing a negative divergence that could be cancelled by stabilizing above the referred to resistance. RSI and MACD tends to be sideways while Linear Regression Indicators crossedover again, all these signals are neutral.
We currently depend on stabilizing within the ascending channel showing on graph, while stability above 1.3720 levels keeps the bullish possibility over the week, and consolidating above 1.3780 strengthens the positive possibility. Of note, if the pair broke 1.3720 levels we will move directly to negativity.

GBP/USD
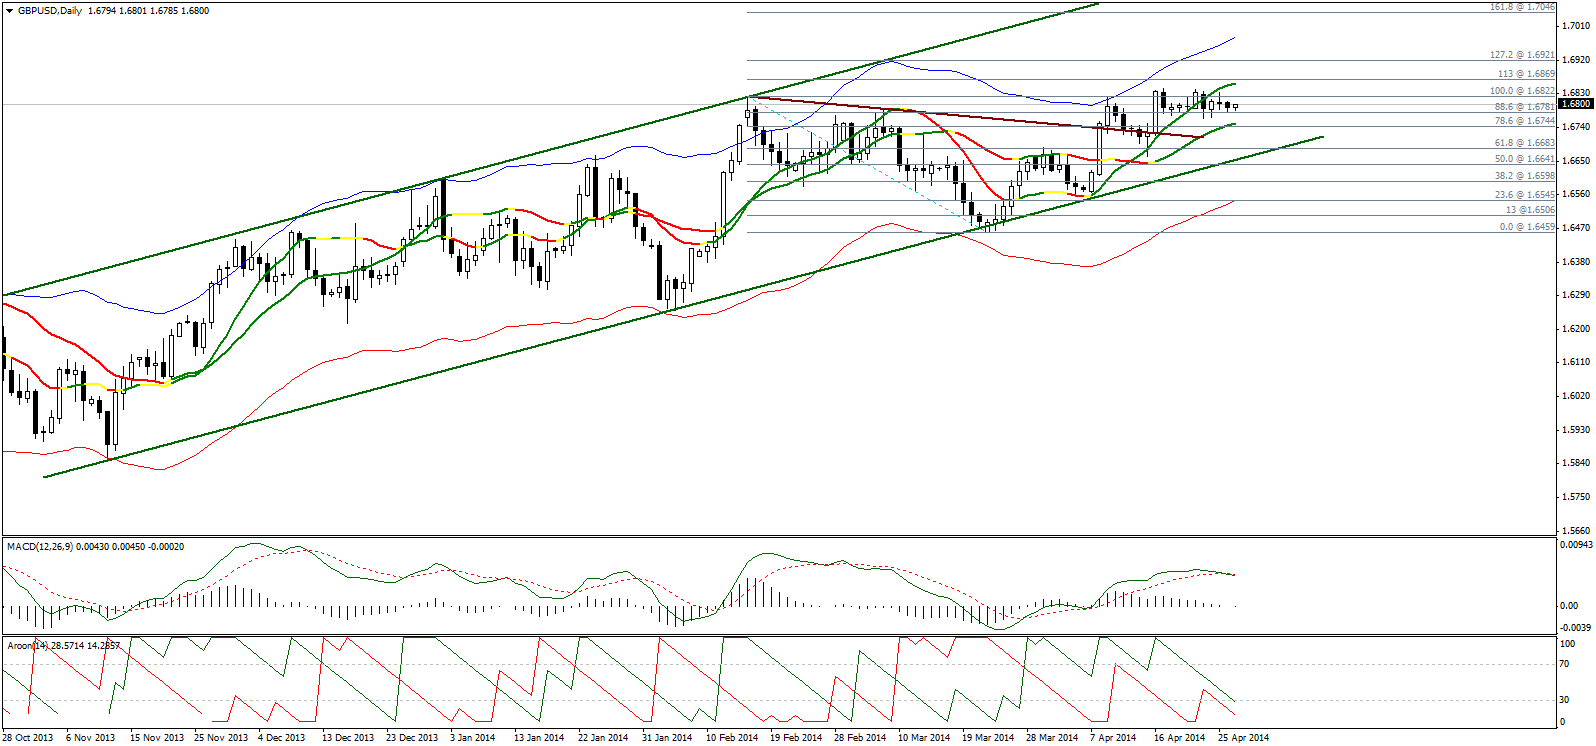
The bullish wave weakened as showing on AROON and MACD Indicators, but the pair is still stable above 1.6780 keeping the bullish possibility of trading within an ascending channel as showing on graph. Linear Regression Indicators are still positive despite that trading is stuck between them.
A break above 1.6825 brings positivity back followed by stability above the referred to level, and the pair has to breach 113% correction at 1.6870 to confirm breaching the referred to resistace. Generally, the positive possibility remains valid as long as the pair is stable above 1.6690, but breaking 1.6640 fails the bullish wave and triggers a new bearish wave.

USD/JPY
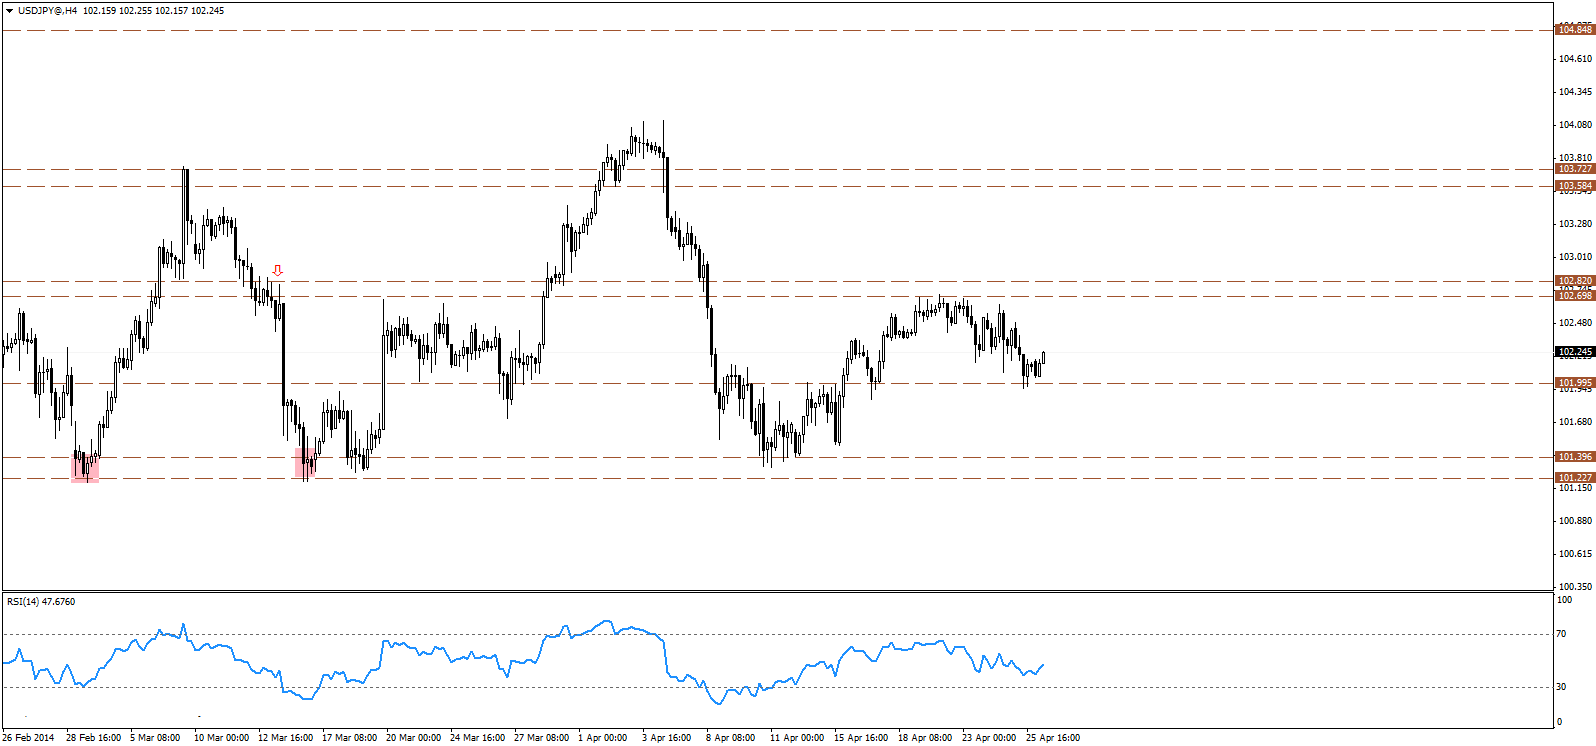
The USD/JPY remains above 102.00 support level, forming a minor double bottom formation over the hourly time interval, and hints price may push higher over intraday basis as long as 102.00 level is intact. The sideways bias remains favored for the week, however for today we favor the bullish scenario.

USD/CHF
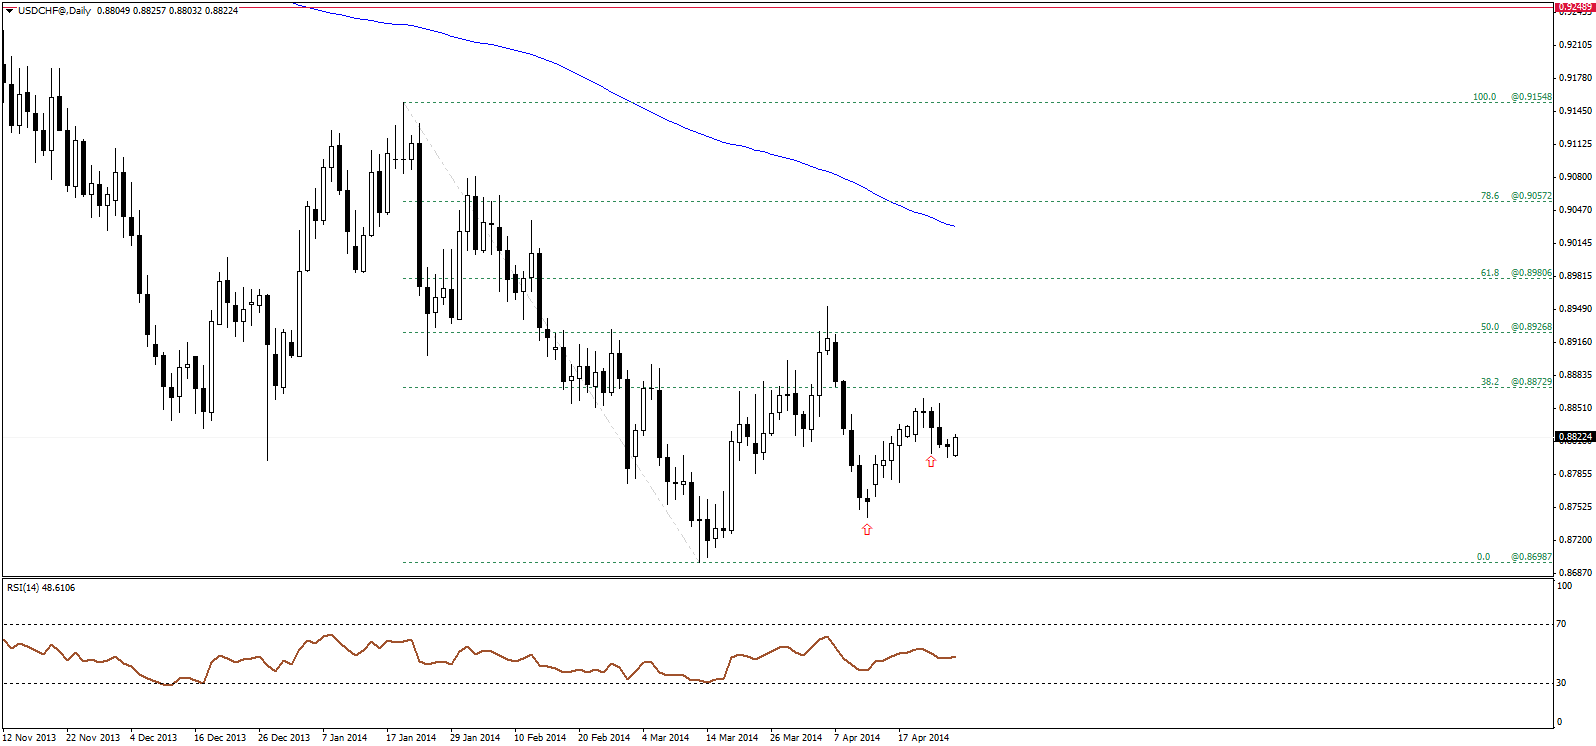
The USD/CHF is fails to break 0.8805 support level, to bounce slightly high with the start of the week. The sideways bias remains clear, as price fails to sustain a direction moving in a sharp up and down wave. Accordingly, we prefer to remain on the sidelines for now, awaiting a technical confirmation signal.

USD/CAD
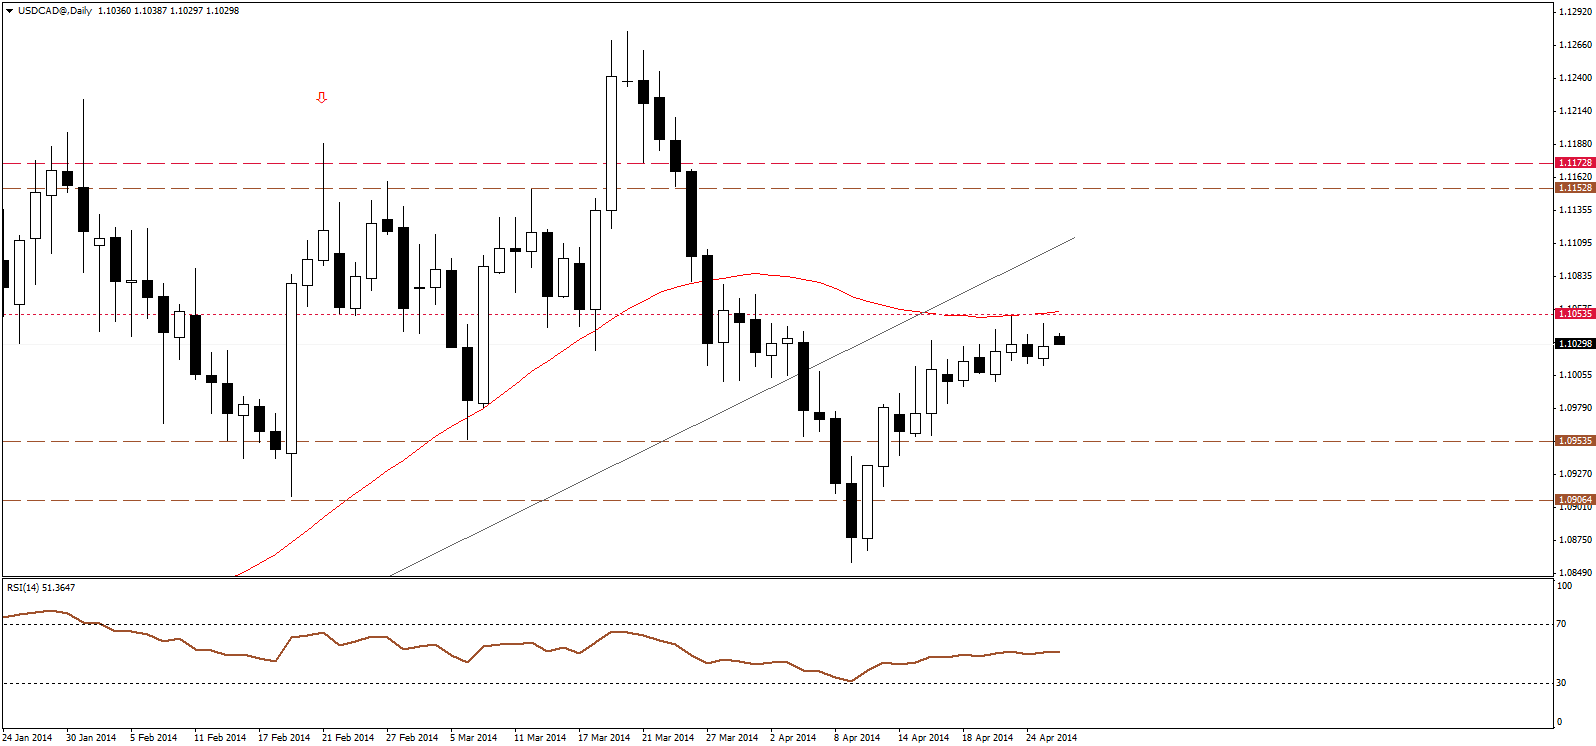
The USD/CAD continues to consolidate below the 50-days SMA and 1.1050 resistance level, where we have seen price being rejected multiple times at this resistance, forming spinning top candles with a long upper shadow, hinting renewed selling pressures at that resistance. Accordingly, we may see a new bearish wave as long as below 1.1050.

AUD/USD
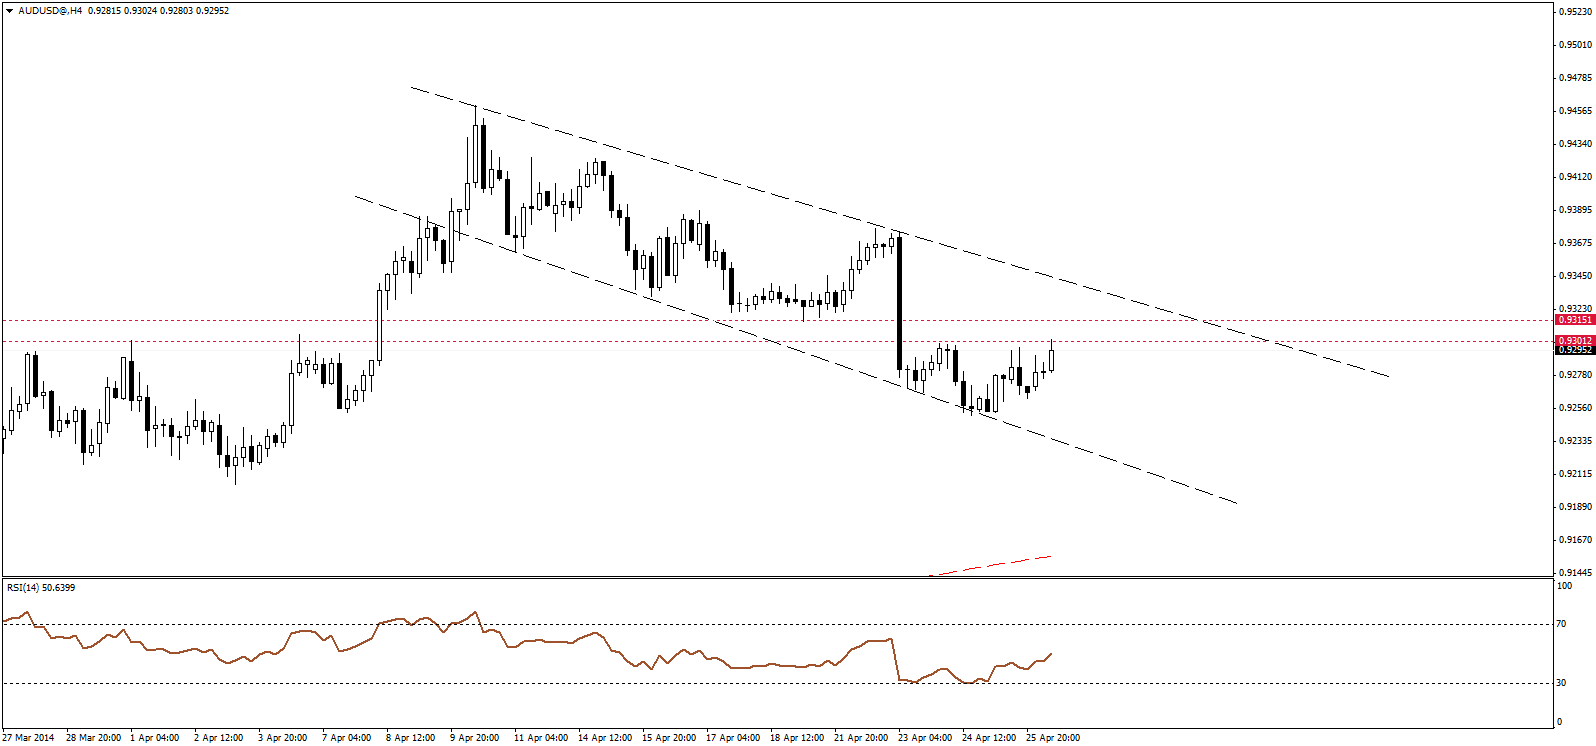
The AUD/USD is retracing higher approaching 0.9300 resistance level, the price could be forming an inverted head and shoulders bullish reversal pattern, however 0.9300 should be taken to confirm the pattern. Meantime, the price is trading within a bullish broadening falling wedge, which has a bullish implication as well. We will wait for a breakout above that resistance area around 0.9300-0.9315 to suggest more upside.

NZD/USD
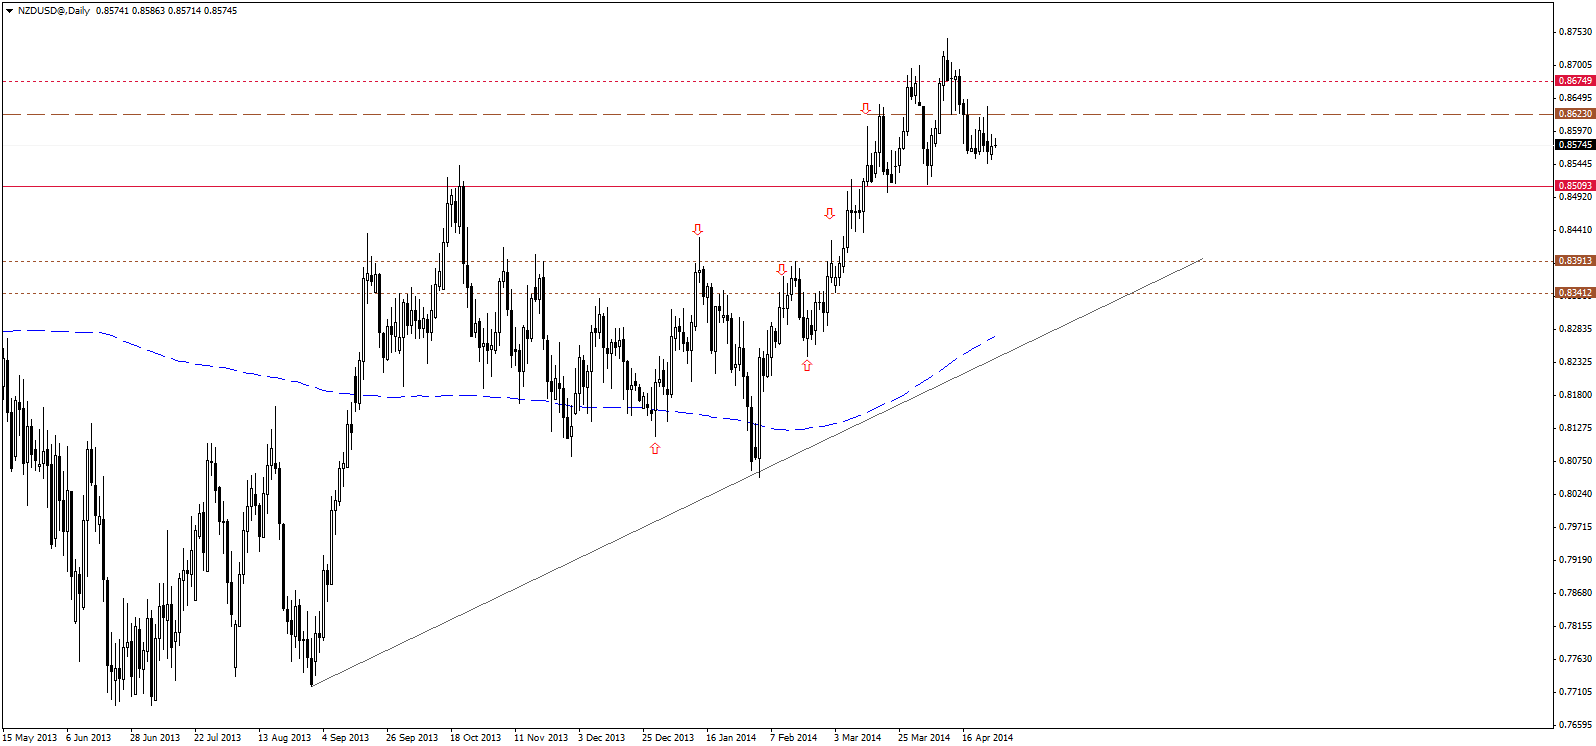
The NZD/USD remains under pressure following the failure at 0.8625 resistance, where price formed a strong bearish candle with a long upper shadow. The price retested 0.8555 support level, where a break below this swing low at 0.8555 will probably confirm another push lower towards the major support at 0.8500 areas. Accordingly, we continue to favor the bearish scenario.

