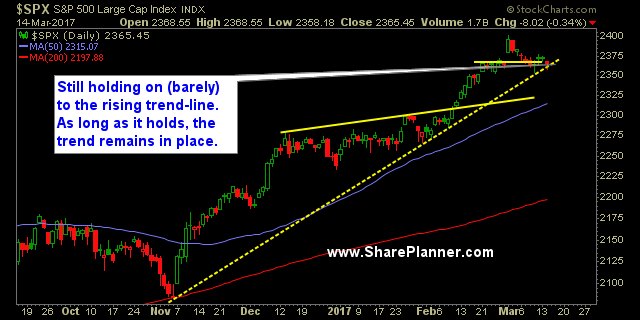
Technical Analysis of the S&P 500's current stock trend remains in tact
That doesn't necessarily mean that all the stocks out there are holding it together because most of them are not. But the large caps, the ones that really drive the market's direction, like Apple (NASDAQ:AAPL) for instance, is still holding it together and that is very important because it helps to camouflage some of the underlying weakness the market is experiencing right now.
On a very short-term basis, this market is absolutely due for a bounce and it will probably happen sooner rather than later. The pullback that the market has seen since the March 1st bounce has been very shallow. Usually when the market has a slight pullback like the one we are currently seeing, the eventual result is a hard bounce that takes price back to its all-time highs.
Technical analysis of stocks trends is important in determining the market's current direction and right now, that trend-line that started during week of the election, back in November of last year, remains intact. It is currently being tested and at one point even dipped below the trend-line on an intraday basis, but the dip buyers managed to rally back strong and keep the trendline intact.
As a result it is very difficult to get heavily short at this juncture. Getting short requires patience and it can't be rushed. The trend-line will eventually break but until then, trade safe.
S&P 500 Chart

Current Stock Trading Portfolio Balance:
- 5 long positions
Recent Stock Trade Notables:
- American Airlines Group (NASDAQ:AAL): Short at 44.76, Closed at 44.03 for a 1.6% profit.
- ProShares UltraPro S&P500 (NYSE:UPRO) (Day-Tade): Long at 95.35, closed at 96.50 for a 1.2% profit.
- Bank of the Ozarks (NASDAQ:OZRK): Long at $56.12, closed at $54.69 for a 2.5% loss.
- Finisar Corporation (NASDAQ:FNSR): Long at $34.25, closed at 34.70 for a 1.3% profit.
- UPRO (Day-Tade): Long at 96.92, closed at 98.03 for a 1.2% profit.
- JP Morgan Chase (NYSE:JPM): Long at 87.21, closed at 89.67 for a 2.8% profit.
- Chevron (NYSE:CVX): Short at 110.03, covered at 111.85 for a 1.6% loss.
- Flex Ltd (NASDAQ:FLEX): Long at $15.62, closed at $16.57 for a 6.1% profit.
- Baidu Inc (NASDAQ:BIDU): Long at $174.70, closed at $187.00 for a 7.0% profit.
- Ollies Bargain Outlet Holdings Inc (NASDAQ:OLLI): Long at 33.20, closed at $32.50 for a 2.1% loss.
- Corning Incorporated (NYSE:GLW): Long at $26.98, closed at $27.45 for a 1.7% profit.
- Illinois Tool Works (NYSE:ITW): Long at $127.74, closed at $129.86 for a 1.7% profit.
- Marriott International Inc (NASDAQ:MAR): Long at $86.16, closed at $87.51 for a 1.6% profit.
