Fundamental analysis, technical analysis and common sense principles comprise the 3-pronged approach used in the BCI methodology for screening for option-selling candidates. Technical analysis is the factor that changes most frequently and is the main reason a stock will get “bumped” from our Premium Stock Reports. In our 11/10/2017 Premium Stock Report, MKS Instruments Inc (NASDAQ:MKSI) was removed from our “eligible” list and moved to our “Passed Previous Weeks & Failed Current Week” section. Since this equity has been on our eligible list for a good part of 2017 and generated a significant amount of income for our members (this author included), I felt it would be instructive to evaluate why the BCI team moved the stock from our highest-rated category.
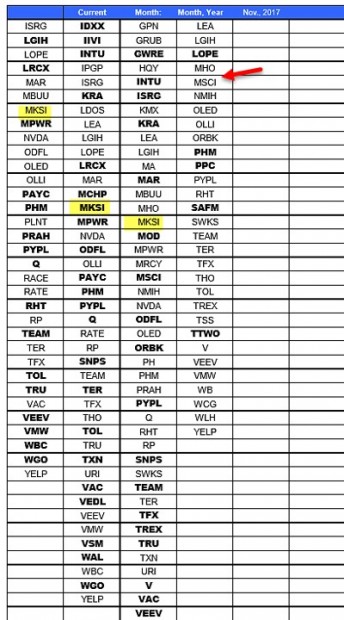
Weeks 1 – 4 for the November 2017 contracts

The yellow fields show that MKSI was eligible in the first 3 weeks of the November contracts but not in the 4th week (red arrow).
Why was MKSI Bumped (moved from white to purple cells)? Report Explanation

The green arrows point out the following technical concerns:
- The momentum indicators (MACD Histogram and Stochastic Oscillator) turned negative
- The price of the stock is no longer above, but rather at, the 20-day exponential moving average
It is important to recognize the fact that stock prices whipsaw and there frequently are technical improvements from week-to-week, so this is the reason we leave formerly eligible securities on our lists for 3 weeks before removing them entirely from our reports. It is not prudent to immediately sell a stock already in our portfolios if it is moved from the eligible white cells. It is, however, always critical to be alert for all exit strategy opportunities.
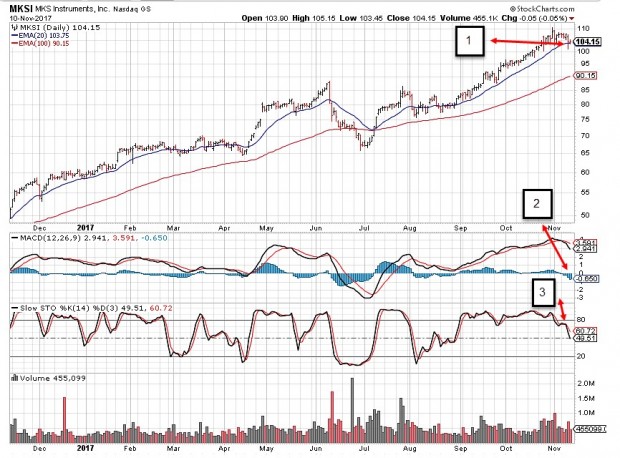
MKSI: Technical chart

The red arrows highlight the following:
- 1: Share price moved down to the 20-day exponential moving average (previously above this line)
- 2: The MACD Histogram moved below the zero-line
- 3: The Stochastic Oscillator dipped below the 80%, a bearish signal
Discussion
Technical analysis is the most common reason for a stock removal from our eligible list. Since stock prices whipsaw, we give the stock 3 weeks to recover before removing the stock entirely from our watch list. When a stock is currently in our portfolio and gets bumped from our watch list, we keep the stock and manage our position with our exit strategy arsenal, if needed.
Market tone
This week’s economic news of importance:
- Case-Shiller home price index March 6.5% (6.5% last)
- Consumer confidence index May 128.0 (127.5 expected)
- ADP employment May 178,000 (163,000 last)
- GDP revision Q1 2.2% (2.3% expected)
- Weekly jobless claims 5/26 221,000 (225,000 expected)
- Personal income April 0.3% (0.3% expected)
- Consumer spending April 0.6% (0.4% expected)
- Pending home sales April -1.3% (0.6% last)
- Nonfarm payrolls May 223,000 (200,000 expected)
- Unemployment rate May 3.8% (3.9% expected)
- Average hourly earnings May 0.3% (0.2% expected)
- Markit manufacturing PMI May 56.4 (56.5 last)
- ISM manufacturing index May 58.7% (58.9% expected)
THE WEEK AHEAD
Mon June 4th
- Factory orders April
Tue June 5th
- ISM nonmanufacturing index May
- Job openings April
Wed June 6th
- Trade deficit April
Thu June 7th
- Weekly jobless claims through 6/2
- Quarterly services Q1
- Consumer credit April
Fri June 8th
- Wholesale inventories April
For the week, the S&P 500 moved up by o.49% for a year-to-date return of 2.28%
Summary
IBD: Confirmed uptrend
GMI: 6/6- Buy signal since market close of April 18, 2018
BCI: Favoring 3 out-of-the-money calls for every 2 in-the-money calls. Politics, as it relates to the global economy, is inhibiting a more aggressive approach to investing.
WHAT THE BROAD MARKET INDICATORS (S&P 500 AND VIX) ARE TELLING US
The 6-month charts point to a neutral to slightly bullish tone. In the past six months, the S&P 500 was up 2% while the VIX (13.46) moved up by 20% (but on a more recent downtrend).
Wishing you much success,
