Brexit Dates May Be Postponed
In this review, we would like to draw your attention to the chart of the British pound vs the New Zealand dollar currency pair. Will the GBP/NZD rise?
Such dynamics indicate the strengthening of the pound against the New Zealand dollar. The main positive factor for the British currency is the plan of Prime Minister Theresa May to postpone the UK's exit date from the EU for a few months. This event is scheduled for March 29, 2019. The next vote on the postponement of Brexit will be held in the British Parliament on March 12. Investors believe that due to the postponement of the exit date, the UK will be able to negotiate with the EU over much more favorable conditions in comparison with the so-called No-deal Brexit, which currently exists. Good economic data on lower inflation and an increase in retail sales in the UK in January became positive factors for the pound. In turn, a negative factor for the New Zealand dollar may be the desire of the Reserve Bank of New Zealand to tighten its capital requirements for local banks (Tier 1 Capital).
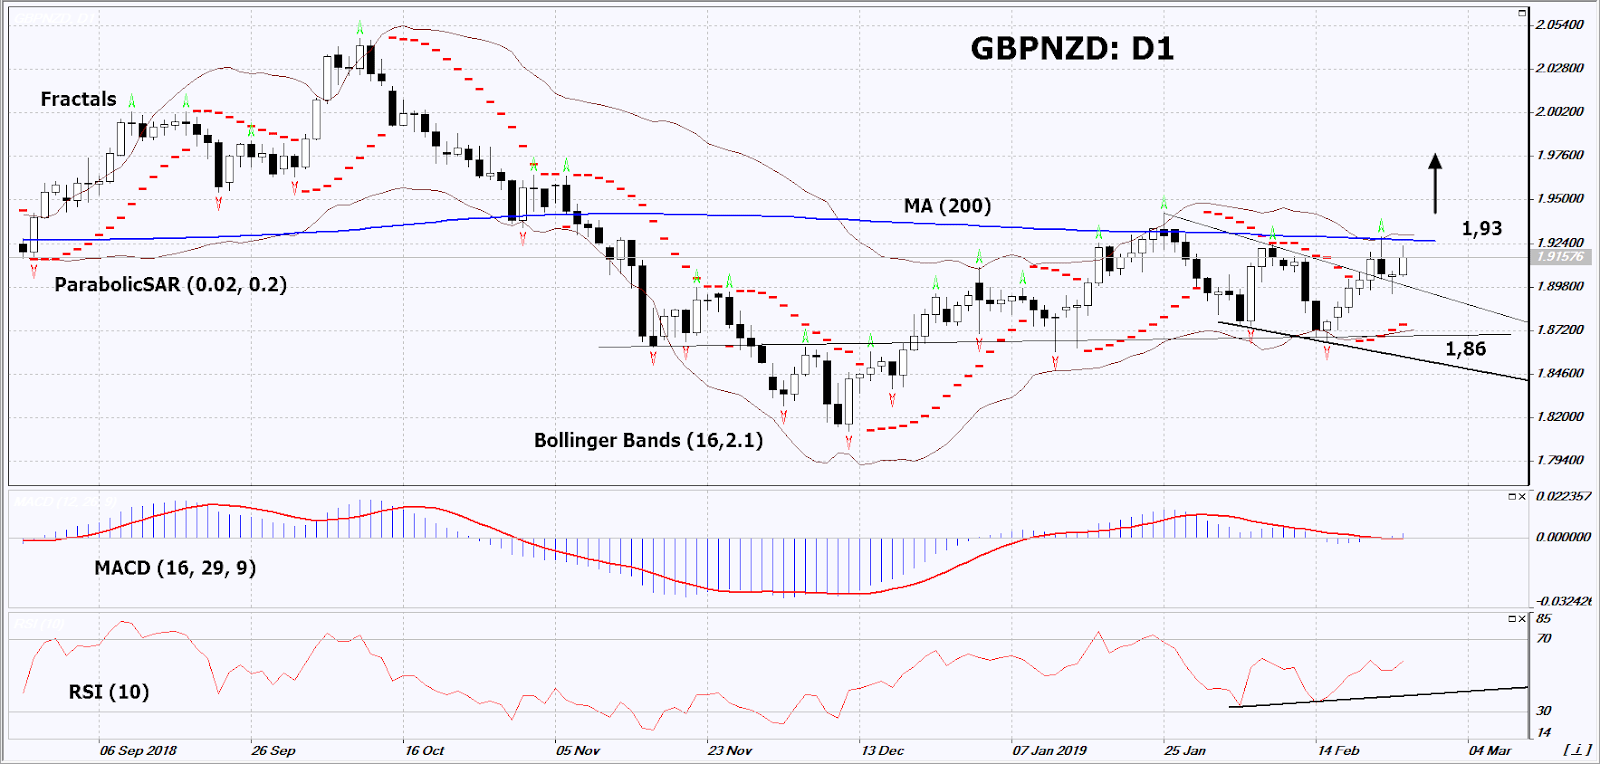
On the daily timeframe, GBP/NZD: D1 is in a neutral trend. A number of technical analysis indicators formed buy signals. The further price increase is possible in case of the settlement of Brexit.
The Parabolic Indicator gives a bullish signal.
The Bollinger® bands have narrowed, which indicates low volatility. Both Bollinger bands are titled upward.
The RSI indicator is above 50. It has formed a positive divergence.
The MACD indicator gives a bullish signal.
The bullish momentum may develop in case GBP/NZD exceeds the upper Bollinger band, the last fractal high and the 200-day moving average line at 1.93. This level may serve as an entry point. The initial stop loss may be placed below the last fractal low, the Parabolic signal and the lower Bollinger band at 1.86. After opening the pending order, we shall move the stop to the next fractal low following the Bollinger and Parabolic signals. Thus, we are changing the potential profit/loss to the breakeven point. More risk-averse traders may switch to the 4-hour chart after the trade and place there a stop loss moving it in the direction of the trade. If the price meets the stop level (1.86) without reaching the order (1.93), we recommend to close the position: the market sustains internal changes that were not taken into account.
Summary Of Technical Analysis
- Position Buy
- Buy stop Above 1.93
- Stop loss Below 1.86
Market Overview
Pakistan and India Air Force crash have not yet had an impact on world markets
Fed Chairman Powell announced that his department will not rush to raise rates
The ICE (NYSE:ICE) US Dollar Index noticeably dropped to a 3-week low after the statement by the Fed Chairman. In 2018, the rate increased 4 times. This year its growth is questionable. A significant part of investors believe that in 2020 the Fed may start another round of easing monetary policy and begin to reduce the rate. An additional negative was the publication of macroeconomic data on new buildings in the US (U.S. housing starts). In December it fell to a 2-year low. US stocks fell at the end of trading. Shares of the construction manufacturer and other wheeled vehicles Caterpillar (NYSE:CAT) fell 1.8% after the UBS Bank downgraded their rating. Today at 14:30 CET the trade balance for December will be released in the USA. At 16:00 CET data on the secondary real estate market, industrial orders and orders for durable goods will be published. Yesterday’s consumer confidence index for February turned out to be positive, if even good data are released today, it can support the dollar.
EUR/USD continued strong growth
This was mainly due to the weakening of the US dollar against the background of the Fed's soft policy. In addition, the growth of the euro could contribute to the UK plans for the settlement of Brexit. Surely due to this the British pound strengthened much stronger, but for the euro also positive sign. Yesterday's change in European stock indexes was minimal. British FTSE 100 dropped amid a strong pound fortification. It reduces the effectiveness of British exporting companies. Today at 11:00 CET indices of business and economic confidence and activity will be released in the Eurozone.
The Japanese Nikkei again gained, although it could not update the recent maximum
Investors' attention is focused on the US President Donald Trump's and the DPRK head Kim Jong Un meeting in Vietnam. It significantly reduces global risks. The US promised prosperity to the DPRK in exchange for abandoning nuclear technology. All this contributed to the strengthening of the Japanese yen and supported Nikkei slightly. Shares of pharmaceutical companies Daiichi Sankyo (+ 3.7%) and Takeda Pharmaceutical (+ 2.1%), as well as real estate companies Mitsui Fudosan, Mitsubishi Estate and Obayashi were in a good demand. Tomorrow morning will be released important macroeconomic data on industrial production and retail trade for January in Japan. The Australian and New Zealand dollar fell this morning due to unexpected cuts in construction costs in Australia for December. New Zealand’s trade balance for January, as was expected, turned out to be negative.
Quotations For Natural Gas Continues Slightly Growing
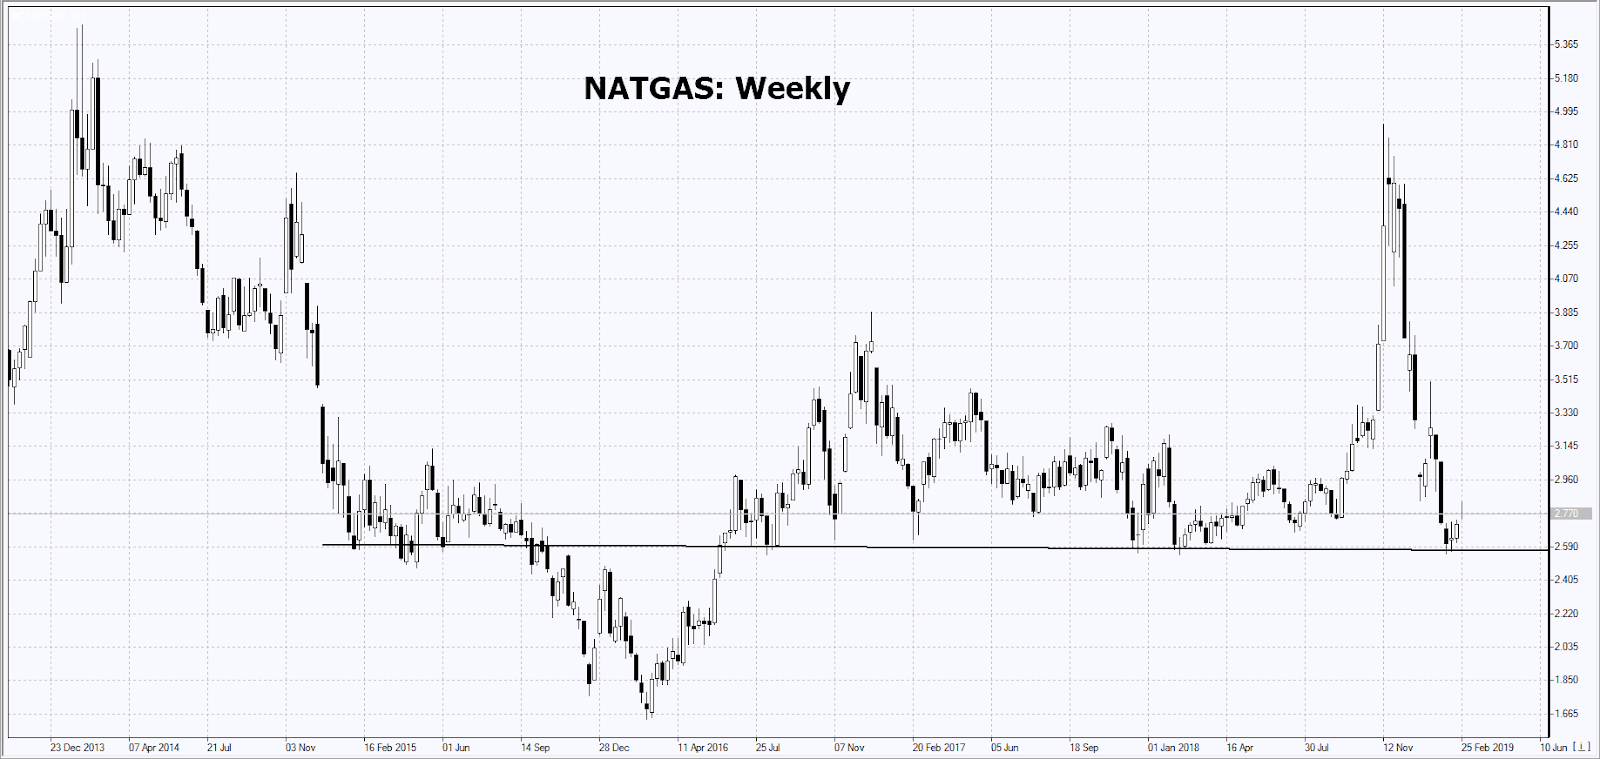
This occurs despite the imminent end of the winter season when gas is used for heating. Quotations are supported by extremely cold weather in Canada. In Calgary the temperature dropped to -29 degrees. In addition the export of liquefied natural gas from the United States this week is 5.2 billion cubic feet, which is 67% more than last year and 5 times more than 5 years ago. As a result the total gas consumption in the US including raw materials for export to Canada, Mexico and other countries is now 20% more than last year.


