
US demand for gas may slump as production hits high
Natural gas price fell 6% last week in US. Its production volumes total 73.1bn cubic feet which is close to historical high hit last year. The gas stocks in US are expected to hit a fresh historical low on Thursday when the weekly EIA data will come out. The stocks are expected to rise 39bn cubic feet to 3179bn cubic feet. Will Natgas continue declining?
Several US weather bureaus forecast a drop in temperature which may reduce demand for gas used to generate power for air conditioning. At the same time their long-term forecasts point at warmer winter in US than usually. Currently the daily average of gas consumption for two weeks is around 10% above the normal daily average in 30 years. Theoretically this may point at potentially lower demand. We do not yet expect the trend reversal in gas prices but also do not rule out the downward correction.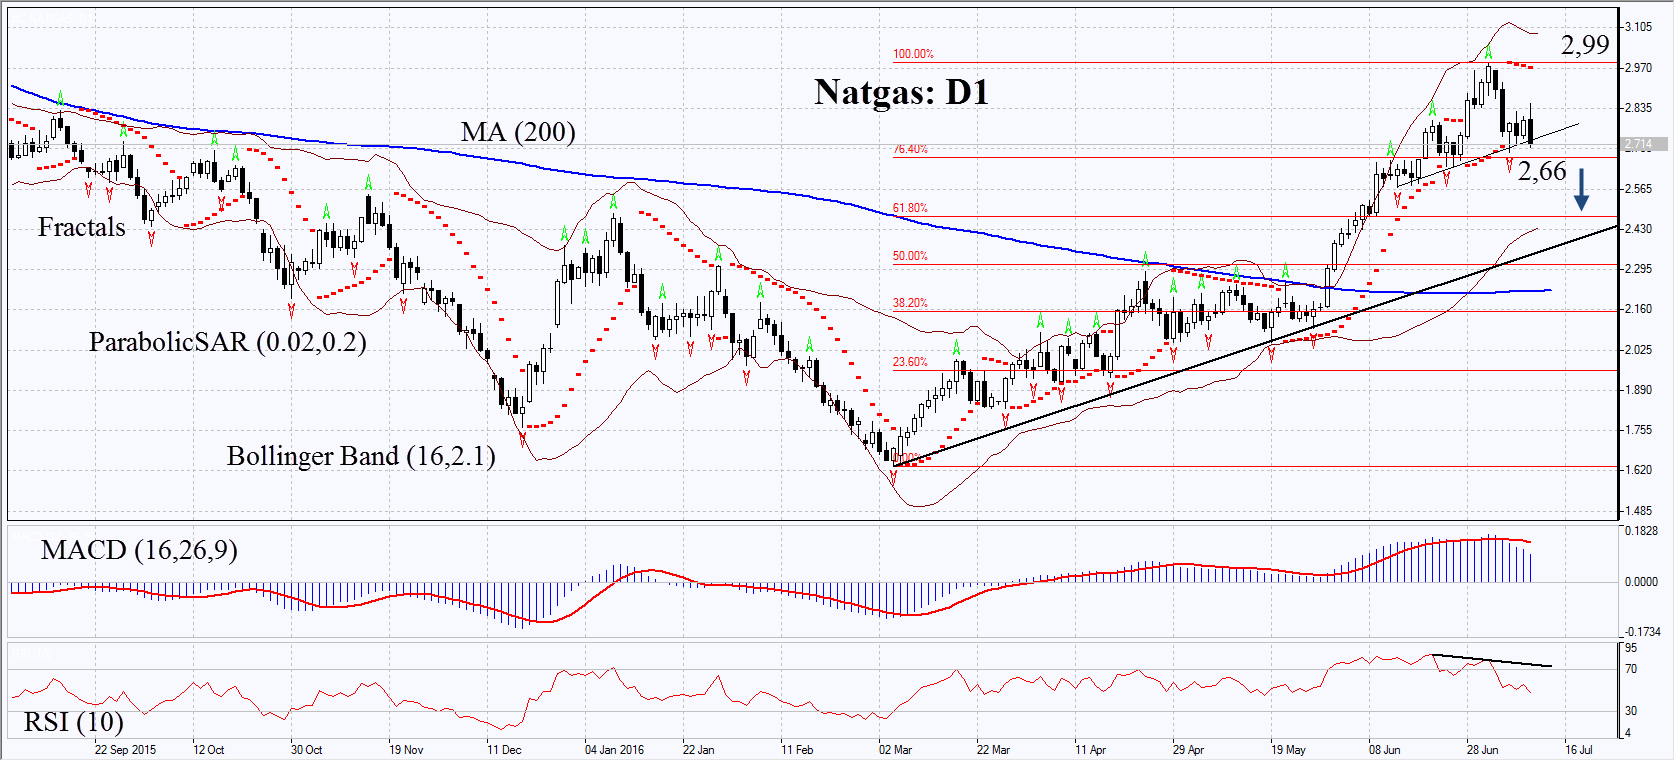
On the daily chart Natgas: D1 continues advancing. Now it is correcting down from its 13-month high and has already broken down through support of the short-term rising trend. The MACD and Parabolic indicators have formed signals to sell. The Bollinger bandshave widened which means higher volatility. The RSI is below 50 having formed negative divergence. The bearish momentum may develop in case the natural gas prices fall below the last fractal low and the first Fibonacci level at 2.66. This level may serve the point of entry. The initial stop-loss may be placed above the Parabolic signal, the last fractal high and 13-month high at 2.99. Having opened the pending order we shall move the stop to the next fractal high following the Parabolic and Bollinger signals. Thus, we are changing the probable profit/loss ratio to the breakeven point. The most risk-averse traders may switch to the 4-hour chart after the trade and place there a stop-loss moving it in the direction of the trade. If the price meets the stop-loss level at 2.99 without reaching the order at 2.66, we recommend cancelling the position: the market sustains internal changes which were not taken into account.
PositionSellSell stopbelow 2.66Stop lossabove 2.99
- English (UK)
- English (India)
- English (Canada)
- English (Australia)
- English (South Africa)
- English (Philippines)
- English (Nigeria)
- Deutsch
- Español (España)
- Español (México)
- Français
- Italiano
- Nederlands
- Português (Portugal)
- Polski
- Português (Brasil)
- Русский
- Türkçe
- العربية
- Ελληνικά
- Svenska
- Suomi
- עברית
- 日本語
- 한국어
- 简体中文
- 繁體中文
- Bahasa Indonesia
- Bahasa Melayu
- ไทย
- Tiếng Việt
- हिंदी
Technical Analysis #C-NATGAS : 2016-07-12
Published 07/12/2016, 08:49 AM
Updated 12/18/2019, 06:45 AM
Technical Analysis #C-NATGAS : 2016-07-12
Latest comments
Loading next article…
Install Our App
Risk Disclosure: Trading in financial instruments and/or cryptocurrencies involves high risks including the risk of losing some, or all, of your investment amount, and may not be suitable for all investors. Prices of cryptocurrencies are extremely volatile and may be affected by external factors such as financial, regulatory or political events. Trading on margin increases the financial risks.
Before deciding to trade in financial instrument or cryptocurrencies you should be fully informed of the risks and costs associated with trading the financial markets, carefully consider your investment objectives, level of experience, and risk appetite, and seek professional advice where needed.
Fusion Media would like to remind you that the data contained in this website is not necessarily real-time nor accurate. The data and prices on the website are not necessarily provided by any market or exchange, but may be provided by market makers, and so prices may not be accurate and may differ from the actual price at any given market, meaning prices are indicative and not appropriate for trading purposes. Fusion Media and any provider of the data contained in this website will not accept liability for any loss or damage as a result of your trading, or your reliance on the information contained within this website.
It is prohibited to use, store, reproduce, display, modify, transmit or distribute the data contained in this website without the explicit prior written permission of Fusion Media and/or the data provider. All intellectual property rights are reserved by the providers and/or the exchange providing the data contained in this website.
Fusion Media may be compensated by the advertisers that appear on the website, based on your interaction with the advertisements or advertisers.
© 2007-2024 - Fusion Media Limited. All Rights Reserved.