🚀 AI-picked stocks soar in May. PRFT is +55%—in just 16 days! Don’t miss June’s top picks.Unlock full list

There's Talk Of A Stock-Market Crash

Published 05/11/2015, 01:28 PM
Updated 07/09/2023, 06:31 AM
GOOGL
-
NYA
-

A MarketWatch opinion piece published on 05/11/15 has the attention-grabbing headline “Countdown to the stock market Crash of 2016 is ticking louder”.

How often have calls for a crash been made in recent years? While we will not attempt to answer the question in a scientific manner, based primarily on curiosity, we searched the Google (NASDAQ:GOOGL) news archives for “stock market crash”. Below is a sample of what we found along with the dates of publication:

  • “Warning: Crash dead ahead. Sell. Get liquid. Now” - 05/25/10
  • “Stock Market Crash Alert, Market is Falling Like a Stone” - 05/26/12
  • “Warning: Stock Market Likely to Crash From Here, 50% Drop!” - 02/28/13
  • “The Bearish Call to End All Bearish Calls” - 01/03/14
  • “Crash of 2014: Like 1929, you’ll never hear it coming” - 02/24/14
  • “New doomsday poll: 99.9% risk of 2014 crash” - 03/17/14
  • “10 peaking megabubbles signal impending stock crash” - 05/09/14
  • “15 Big Oil sell signals that warn of a 50% stock crash” - 10/27/14
  • “Five reasons why markets are heading for a crash” - 12/02/14

Easier To Pay Attention vs. Forecasting

Forecasting is difficult. Given the almost limitless number of variables, forecasting in the financial markets is very difficult. While anything is possible at any time, markets typically offer some advance warning before a crash. No one knows if a crash is coming, but we know with 100% certainty that another bear market is somewhere in our investing future -- it is only a matter of time. How does the big picture look now? This week’s stock market video can help us address that question using probabilities rather than fear.

Investment Implications - The Weight Of The Evidence

The concept of monitoring hard data is expanded a bit in this 2014 article. Given what we know today, the hard data continues to favor an equity-heavy allocation. The longer the broader NYSE Composite Stock Index can hold above 11,104, the better for the bullish case (see chart below). A move below 11,104 puts us back into the “low conviction” trading range that has bounded stocks for over ten months.
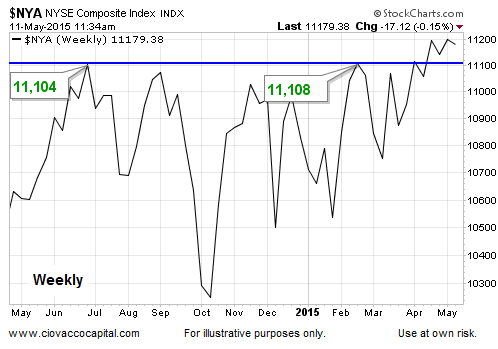
The NYSE Composite

Latest comments

Loading next article…
Risk Disclosure: Trading in financial instruments and/or cryptocurrencies involves high risks including the risk of losing some, or all, of your investment amount, and may not be suitable for all investors. Prices of cryptocurrencies are extremely volatile and may be affected by external factors such as financial, regulatory or political events. Trading on margin increases the financial risks.
Before deciding to trade in financial instrument or cryptocurrencies you should be fully informed of the risks and costs associated with trading the financial markets, carefully consider your investment objectives, level of experience, and risk appetite, and seek professional advice where needed.
Fusion Media would like to remind you that the data contained in this website is not necessarily real-time nor accurate. The data and prices on the website are not necessarily provided by any market or exchange, but may be provided by market makers, and so prices may not be accurate and may differ from the actual price at any given market, meaning prices are indicative and not appropriate for trading purposes. Fusion Media and any provider of the data contained in this website will not accept liability for any loss or damage as a result of your trading, or your reliance on the information contained within this website.
It is prohibited to use, store, reproduce, display, modify, transmit or distribute the data contained in this website without the explicit prior written permission of Fusion Media and/or the data provider. All intellectual property rights are reserved by the providers and/or the exchange providing the data contained in this website.
Fusion Media may be compensated by the advertisers that appear on the website, based on your interaction with the advertisements or advertisers.
© 2007-2024 - Fusion Media Limited. All Rights Reserved.