Get 40% Off
🚨 Volatile Markets? Find Hidden Gems for Serious OutperformanceFind Stocks Now

Tadawul All Share Index May Soon Run Out Of Steam

Published 11/13/2016, 07:52 AM
Updated 07/09/2023, 06:31 AM

There is now a reasonable argument that the Tadawul All Share (Saudi Stock Exchange) is extended with the probability of a retracement of some note the highest it’s been since hitting the bottom at 5,327.49 five weeks ago.There’s no sign yet that this rally has come to an end, but there are indications that the move is getting extended with the index now hitting a key potential resistance area identified by multiple indicators.
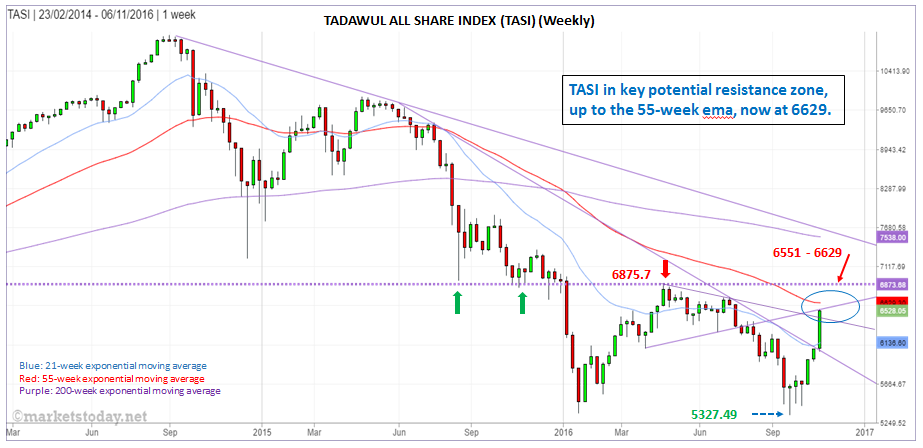
TASI Weekly Chart

At last week’s high of 6,550.61, the TASI had advanced 23% off the 5,327.49 low from five weeks ago. A 78.6% Fibonacci retracement was hit on Thursday at 6,544.38 and the week’s high hit resistance of the neckline of a head and shoulders top formation. A little above last week’s high is resistance of the 55-week exponential moving average at 6,629. Together this creates a high probability potential resistance zone from 6,550.61 to around 6,629.

Alternatively, if the TASI can sustain upward momentum above the 55-week ema then the next higher targets include 6,703 (prior minor peak, right shoulder of head and shoulders top), followed by the 2016 high at 6,875.70.
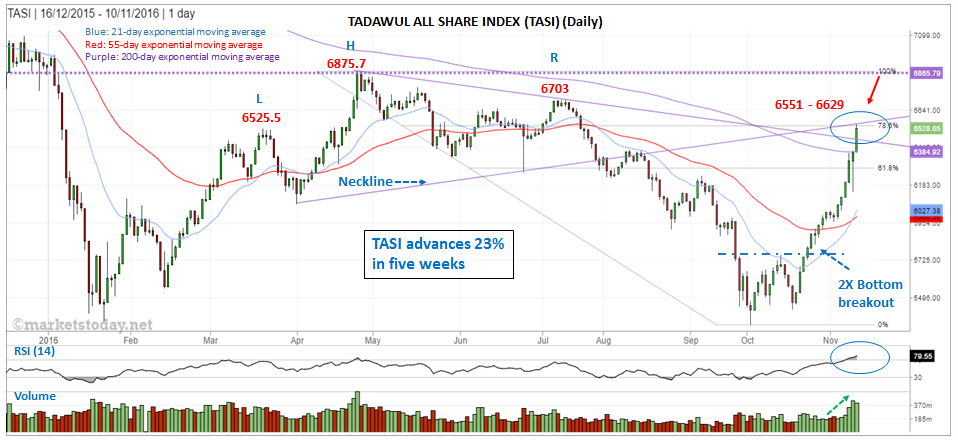
TASI Daily Chart

When looking at the 14-day relative strength index (RSI) momentum oscillator you can see that it is now clearly overbought – the most overbought since August 2014. That’s when the index peaked leading to a two year downtrend, where it remains today. By itself not a strong enough signal but when combined with other elements,as noted above,it adds to the weight of evidence that the odds of going higher before a pullback are decreasing.

3rd party Ad. Not an offer or recommendation by Investing.com. See disclosure here or remove ads .

Another way to look at momentum is to look at the speed of the 23% current ascent. It took only 28 days. This is not unprecedented, as the TASI gained around 24% in 8 days back in December 2014, but it is unusual. It is the second most dramatic rise within such a short time when compared with all other similar advances that occurred since the 2014 peak. This speaks to the strength of the rally but also highlights the increasing probability that the risk of a correction is growing.

Latest comments

Risk Disclosure: Trading in financial instruments and/or cryptocurrencies involves high risks including the risk of losing some, or all, of your investment amount, and may not be suitable for all investors. Prices of cryptocurrencies are extremely volatile and may be affected by external factors such as financial, regulatory or political events. Trading on margin increases the financial risks.
Before deciding to trade in financial instrument or cryptocurrencies you should be fully informed of the risks and costs associated with trading the financial markets, carefully consider your investment objectives, level of experience, and risk appetite, and seek professional advice where needed.
Fusion Media would like to remind you that the data contained in this website is not necessarily real-time nor accurate. The data and prices on the website are not necessarily provided by any market or exchange, but may be provided by market makers, and so prices may not be accurate and may differ from the actual price at any given market, meaning prices are indicative and not appropriate for trading purposes. Fusion Media and any provider of the data contained in this website will not accept liability for any loss or damage as a result of your trading, or your reliance on the information contained within this website.
It is prohibited to use, store, reproduce, display, modify, transmit or distribute the data contained in this website without the explicit prior written permission of Fusion Media and/or the data provider. All intellectual property rights are reserved by the providers and/or the exchange providing the data contained in this website.
Fusion Media may be compensated by the advertisers that appear on the website, based on your interaction with the advertisements or advertisers.
© 2007-2024 - Fusion Media Limited. All Rights Reserved.