Now that global economic growth is decelerating, many investors are flocking to defensive, recession-resistant equities. This tends to happen during late stages of an economic cycle, as well as during mid-cycle slowdowns between periods of growth.
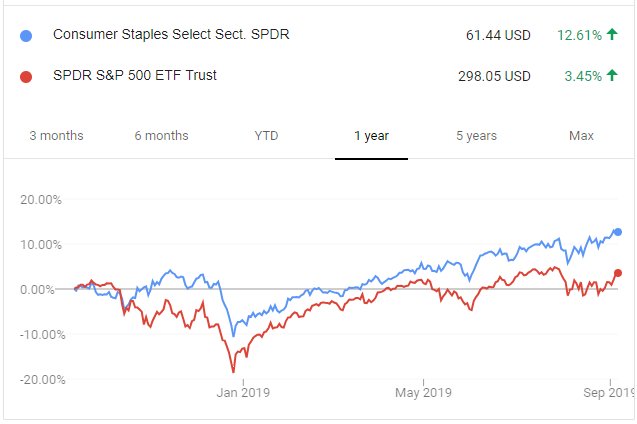
For example, the consumer staples sector has outperformed the broader S&P 500 by over 9% over the past 12 months:
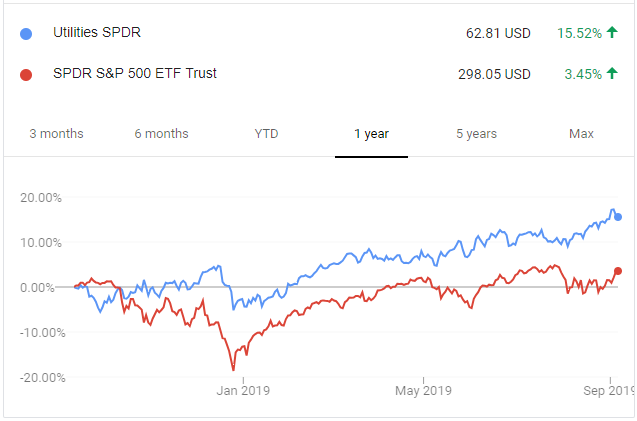
And the utilities sector has outperformed by more than 12%:
The problem, however, is that these sectors are becoming very expensive. For example, the SPDR Utilities Select Sector ETF (MX:XLU) has a P/E ratio of 23.58 with expected forward growth of just 5.34%, resulting in a P/E/G ratio of 4.4 and a dividend-adjusted P/E/G ratio of over 2.8.
For those that are not familiar, the P/E/G ratio is the price-to-earnings (P/E) ratio of a stock or group of stocks divided by the earnings growth rate (G), and was popularized by famous investor Peter Lynch. The lower the number, the more growth you are getting relative to the valuation, which is good. Lynch, whose Magellan Fund massively outperformed during his tenure as portfolio manager, looked for companies with a P/E/G ratio below 1, although these days, even finding a stock below 2 is attractive. The dividend-adjusted version of the calculation adds the dividend yield to the growth rate, which makes the ratio fairer to moderate-growth higher-yielding stocks.
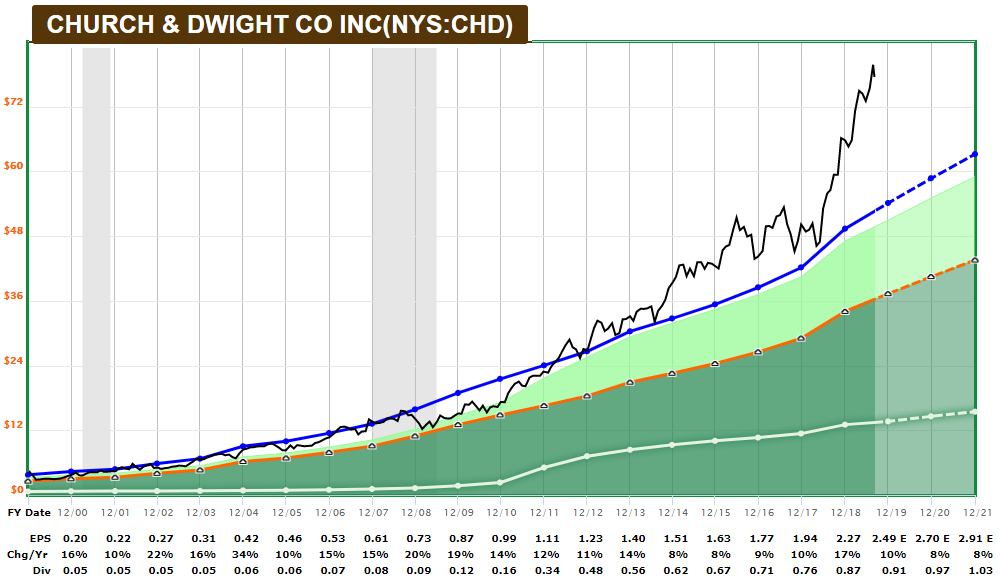
Perhaps more concerning is that major stocks in both the consumer staples and utility sectors have broken far above their normal valuation ranges. Investors are fleeing from more cyclical businesses like industrials and small-cap stocks, and crowding into these defensive names. Many investors aren’t interested in holding bonds either, because yields on most safe bonds these days are below the inflation rate.
For example, Church & Dwight Company (NYSE:CHD), the maker of the Arm & Hammer brand and other leading recession-resistant household products, is trading far above its historical average P/E ratio represented by the blue line:
Sysco Corporation (NYSE:SYY): Defensive but Reasonably-Priced
Sysco Corporation (NYSE:SYY) is a defensive company that distributes food to restaurants, hotels, hospitals, and other facilities. They’re the largest food distributor in the world and have built up a considerable set of infrastructure which gives them a cost advantage over competitors.
The company has raised its annual dividend for 49 consecutive years, including through at least six recessions. Their earnings growth rate has been 7.2% per year over the past decade, and consensus analyst expectations are for 7.5% growth over the next three years.
If there’s one notable flaw for this stock, it’s that the balance sheet is mediocre. The company has a net debt/income ratio of just under 5, which is near the high end of my allowed range. However, its free cash flows often exceed net income, and are very stable, which justifies the leverage and keeps it relatively safe. Basically, the stock doesn’t have a bad balance sheet, but it doesn’t have a fortress balance sheet that many investors in this space would prefer. Investors would do well to keep an eye on this figure to make sure it doesn’t creep up much higher.
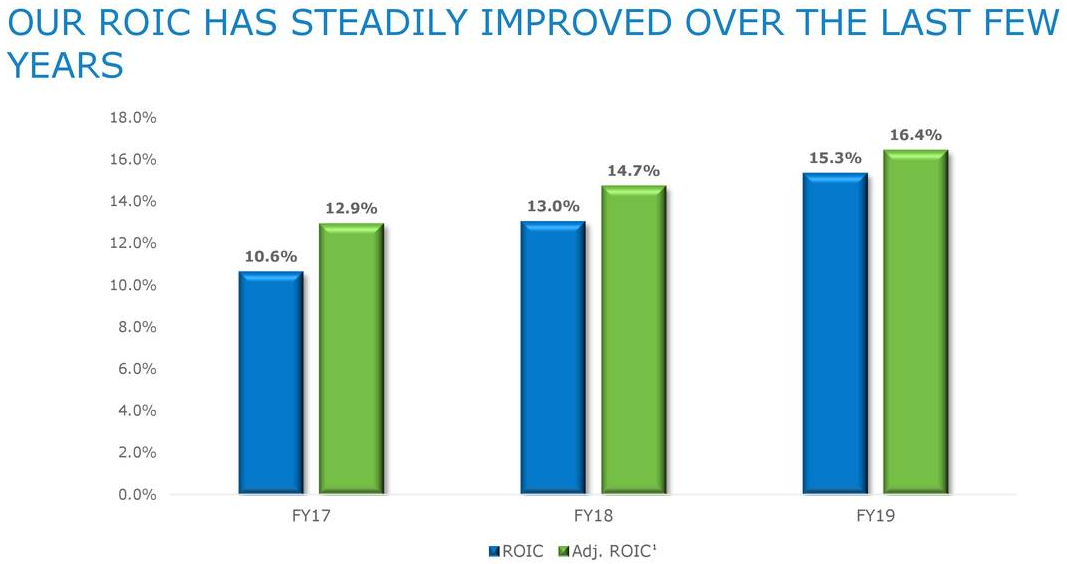
The company consistently earnings returns on invested capital (ROIC) in the double digits, which is above its weighted-average cost of capital (WACC) and is evidence of a substantial economic moat. In addition, Sysco (NYSE:SYY) management actively targets high ROIC, which research has shown tends to be one of the most strongly correlated metrics with stock performance.
Sysco (NYSE:SYY) is not quite as expensive as many of its defensive peers. For starters, it trades in line with its historical average P/E ratio:
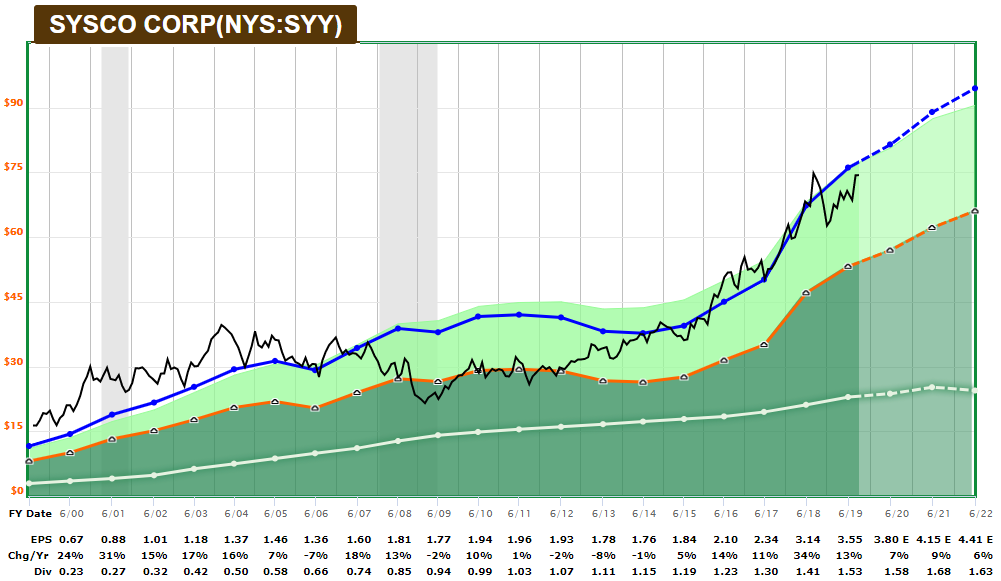
With a P/E ratio of 23.65 and earnings growth of 7.5%, Sysco (NYSE:SYY) has a P/E/G ratio of 3.15 and a dividend-adjusted P/E/G ratio of less than 2.5. While this may not be a deep bargain, the risk-adjusted returns for the stock are decent compared to safe bonds, other defensive stocks, and perhaps the broad U.S. stock market in general.
Overall, Sysco (NYSE:SYY) is a reasonable stock for safe and growing dividends as part of a diversified portfolio and is likely a good candidate to buy on dips.
