Stocks (SPX):
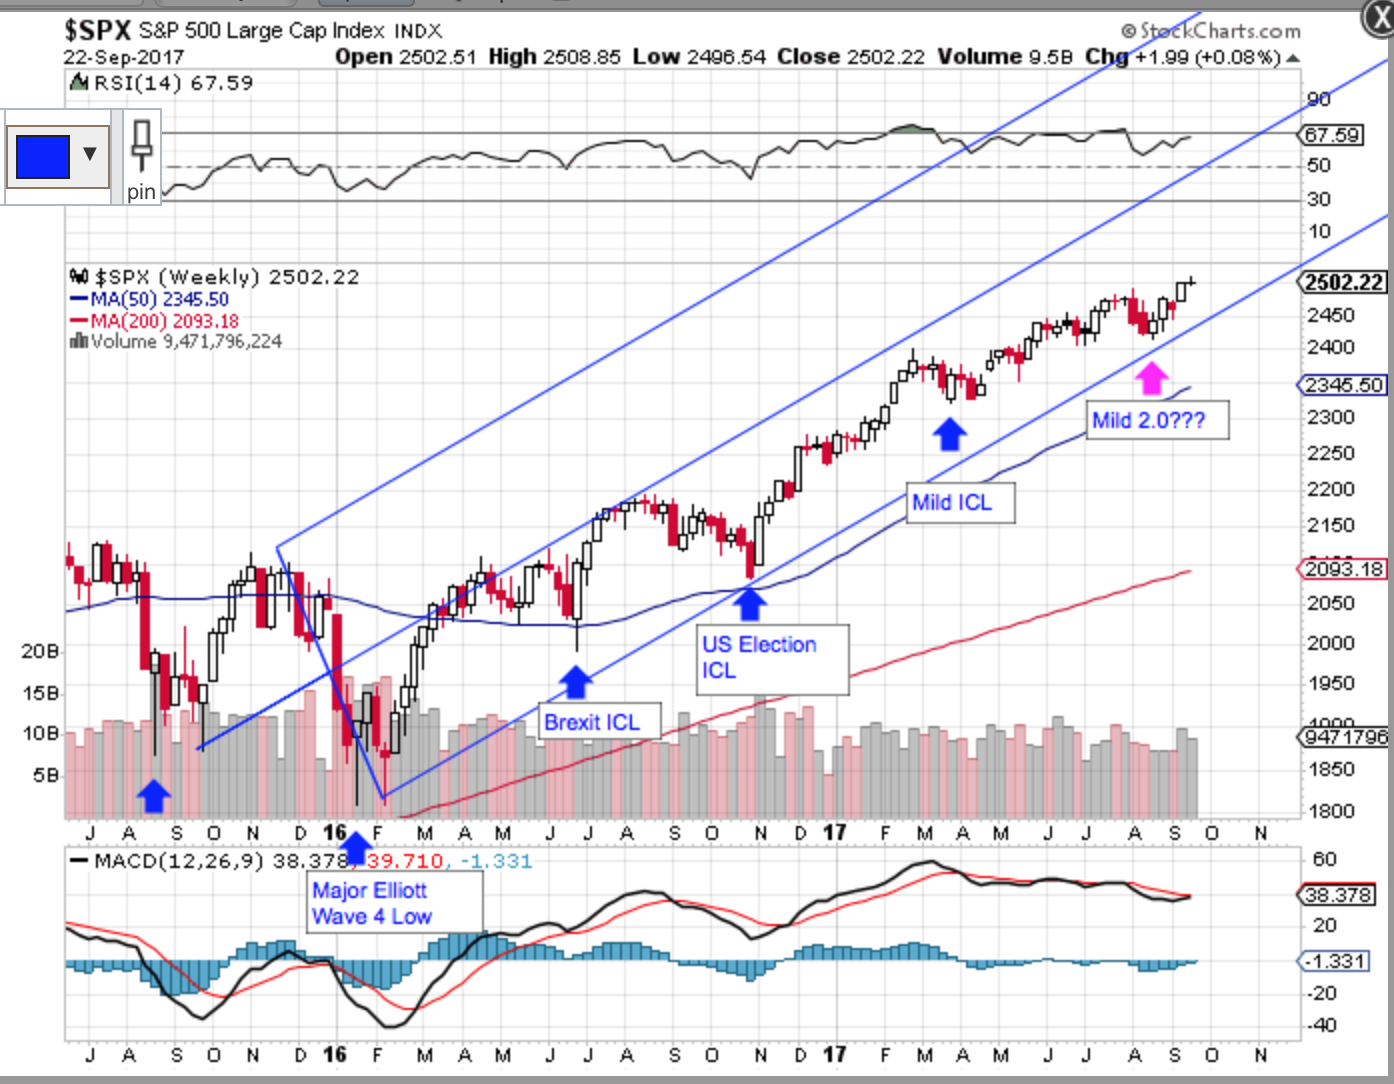
Cycle Status/Outlook: S&P 500 is in a Wave 5 topping pattern out of the 2009 low (note that the 2016 low was a Wave 4 low and we are now in Wave 5). I am looking for a Intermediate low later this Fall and then perhaps a final push into a Wave 5 top perhaps into the Spring of 2018.
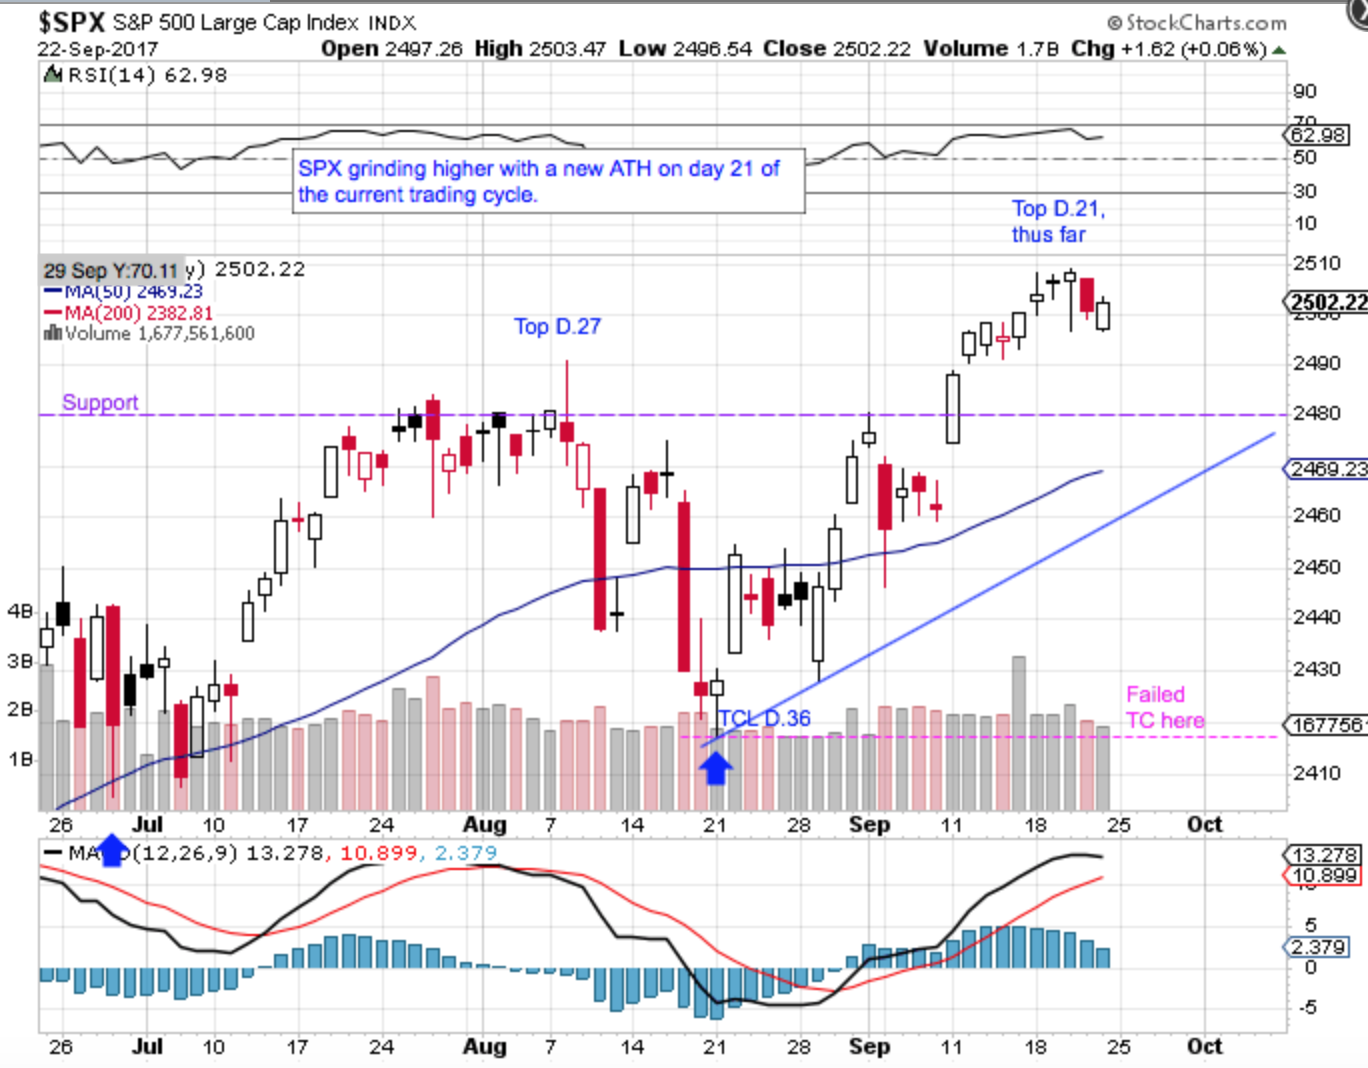
Short term bullish after another new ATH on the SPX this past week on day 21. We are slightly lower on day 23 but a 21 day high shifts the odds in favor of a right translated cycle that will make a higher low.
My longer Intermediate Cycle count is looking lower unless we may well have had another mild ICL in mid-August.
Gold and PMs:
Cycle Status/Outlook:
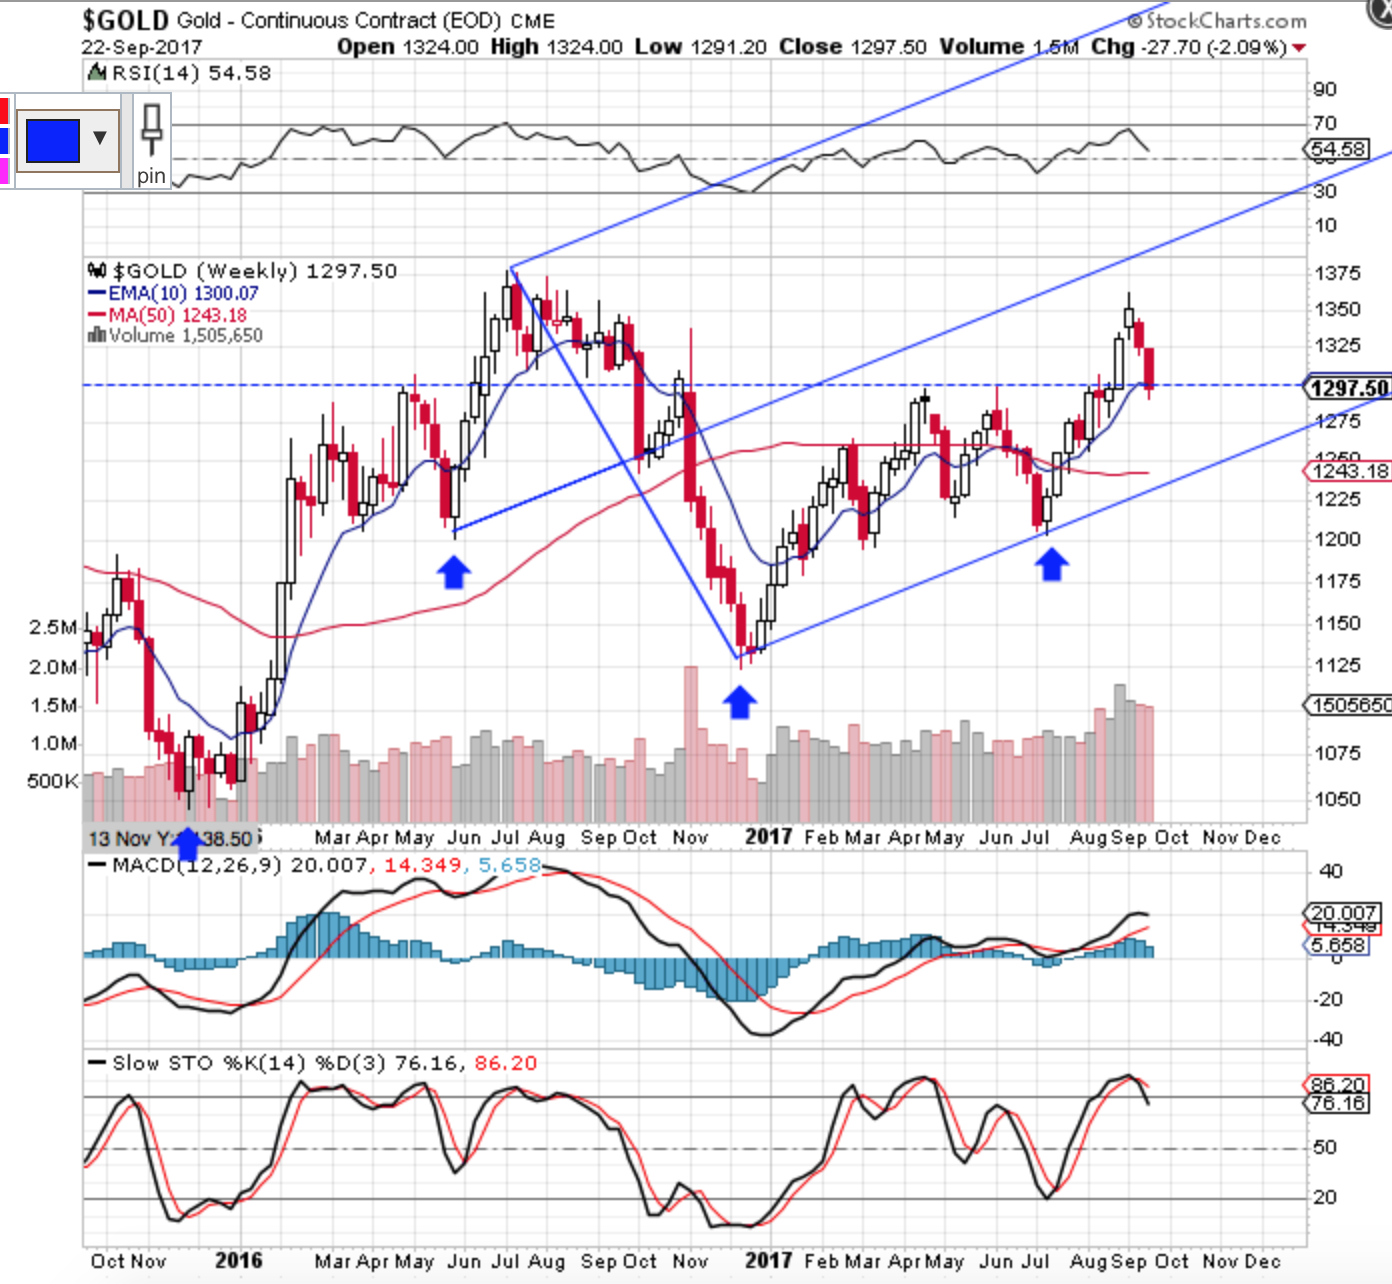
Longer term Cycle outlook is that Gold is in the early phases of a new Cyclical Bull within a longer Secular Bull that started in 2000.
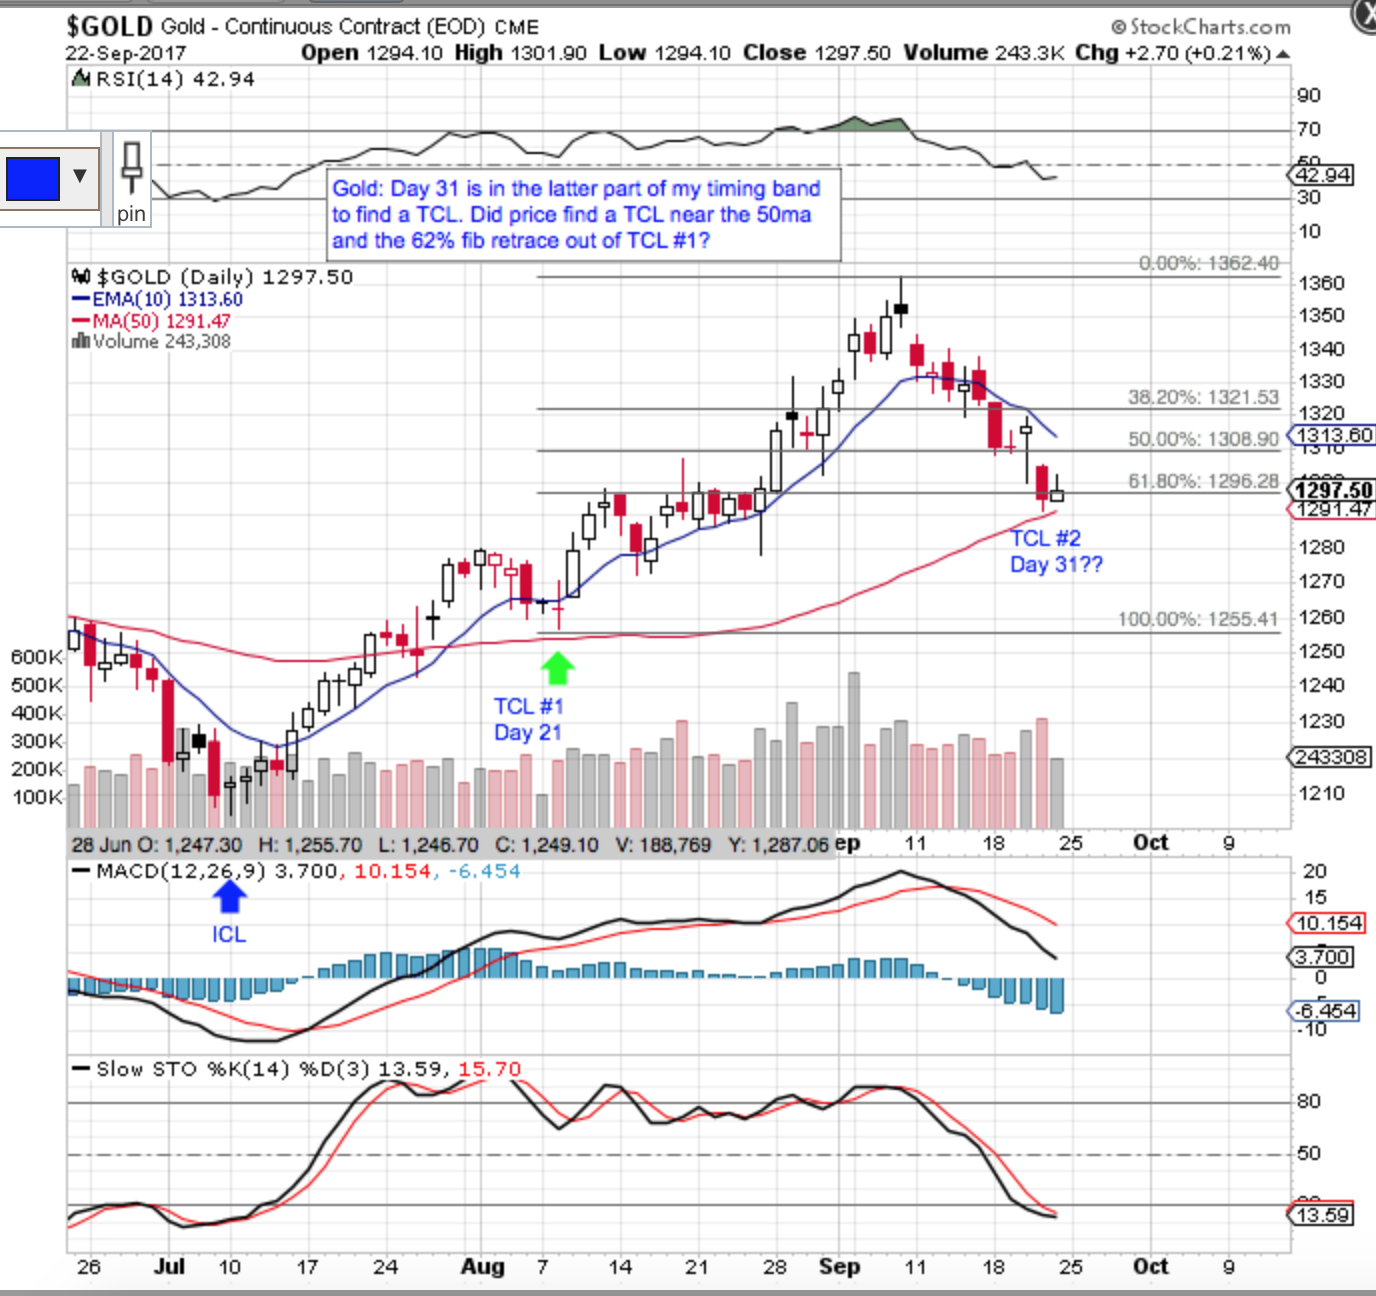
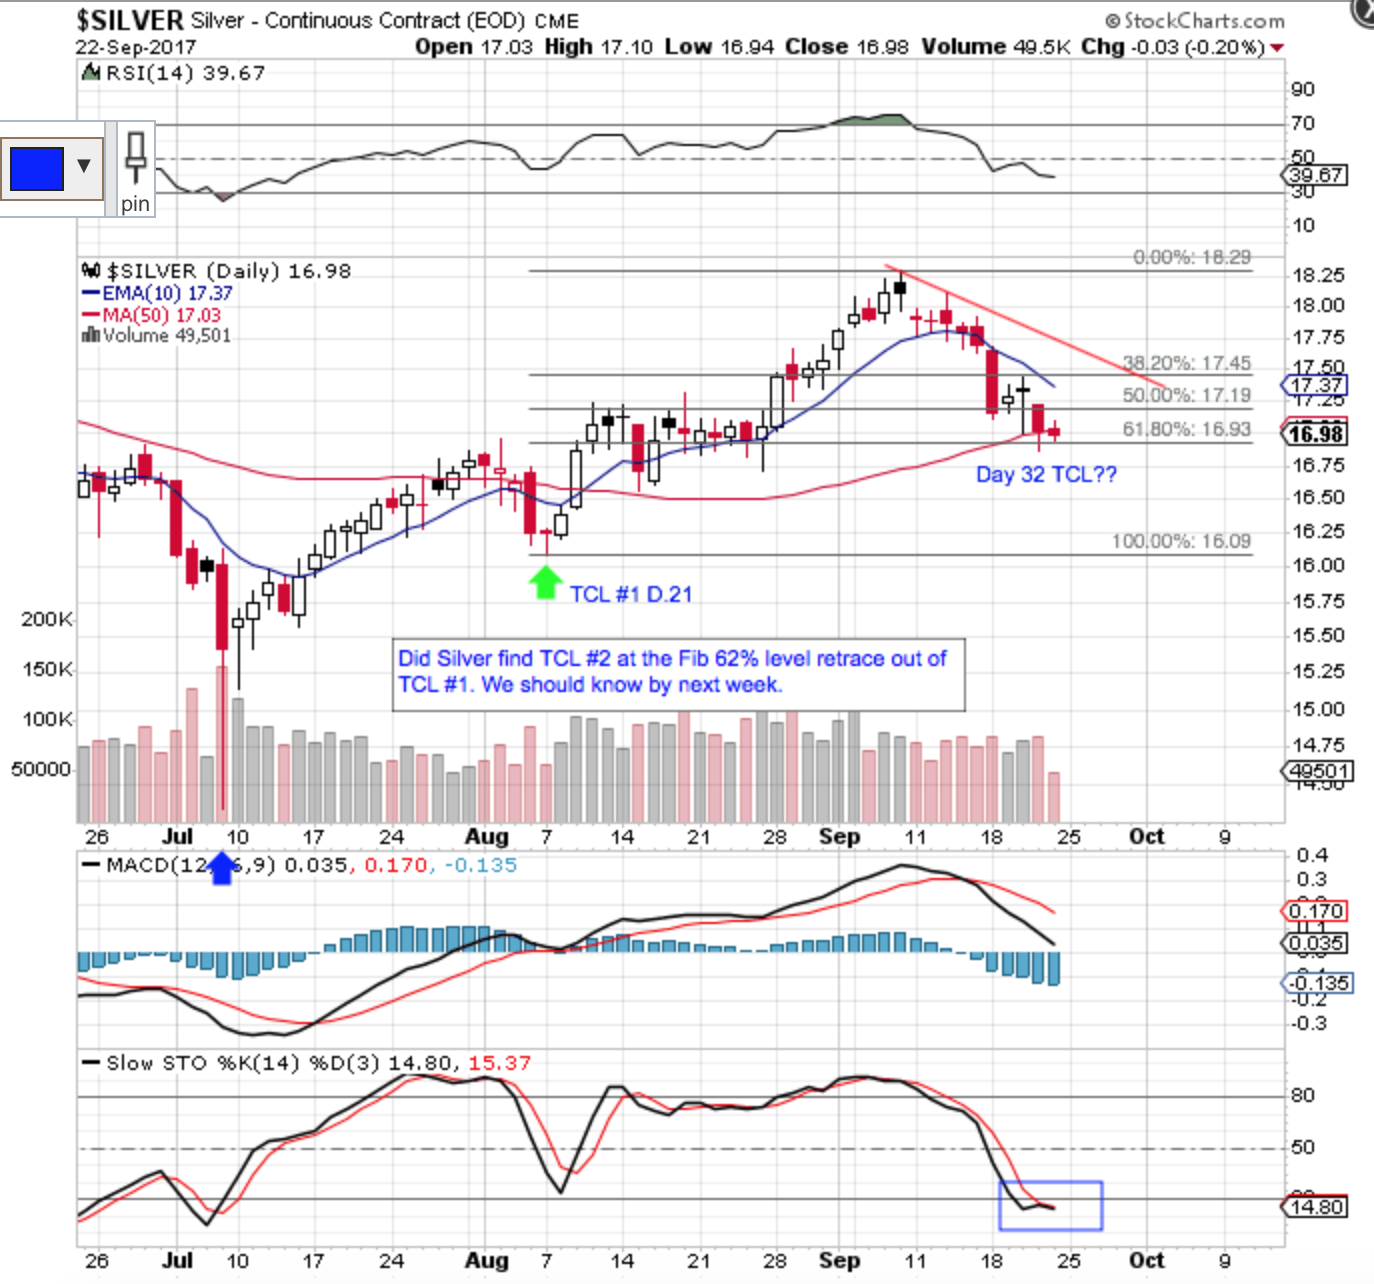
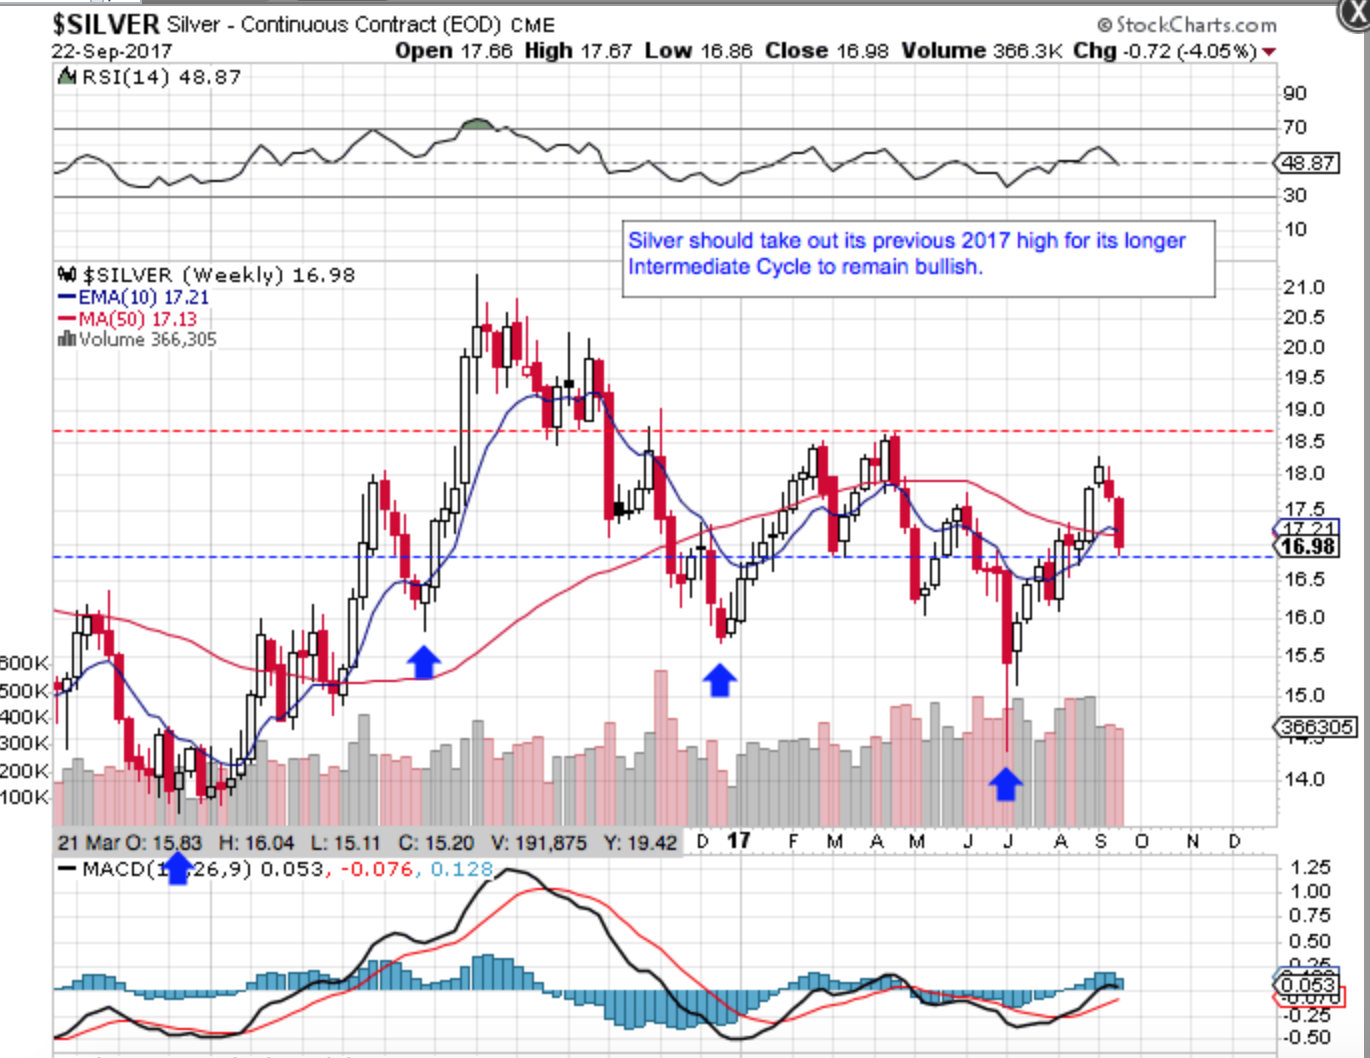
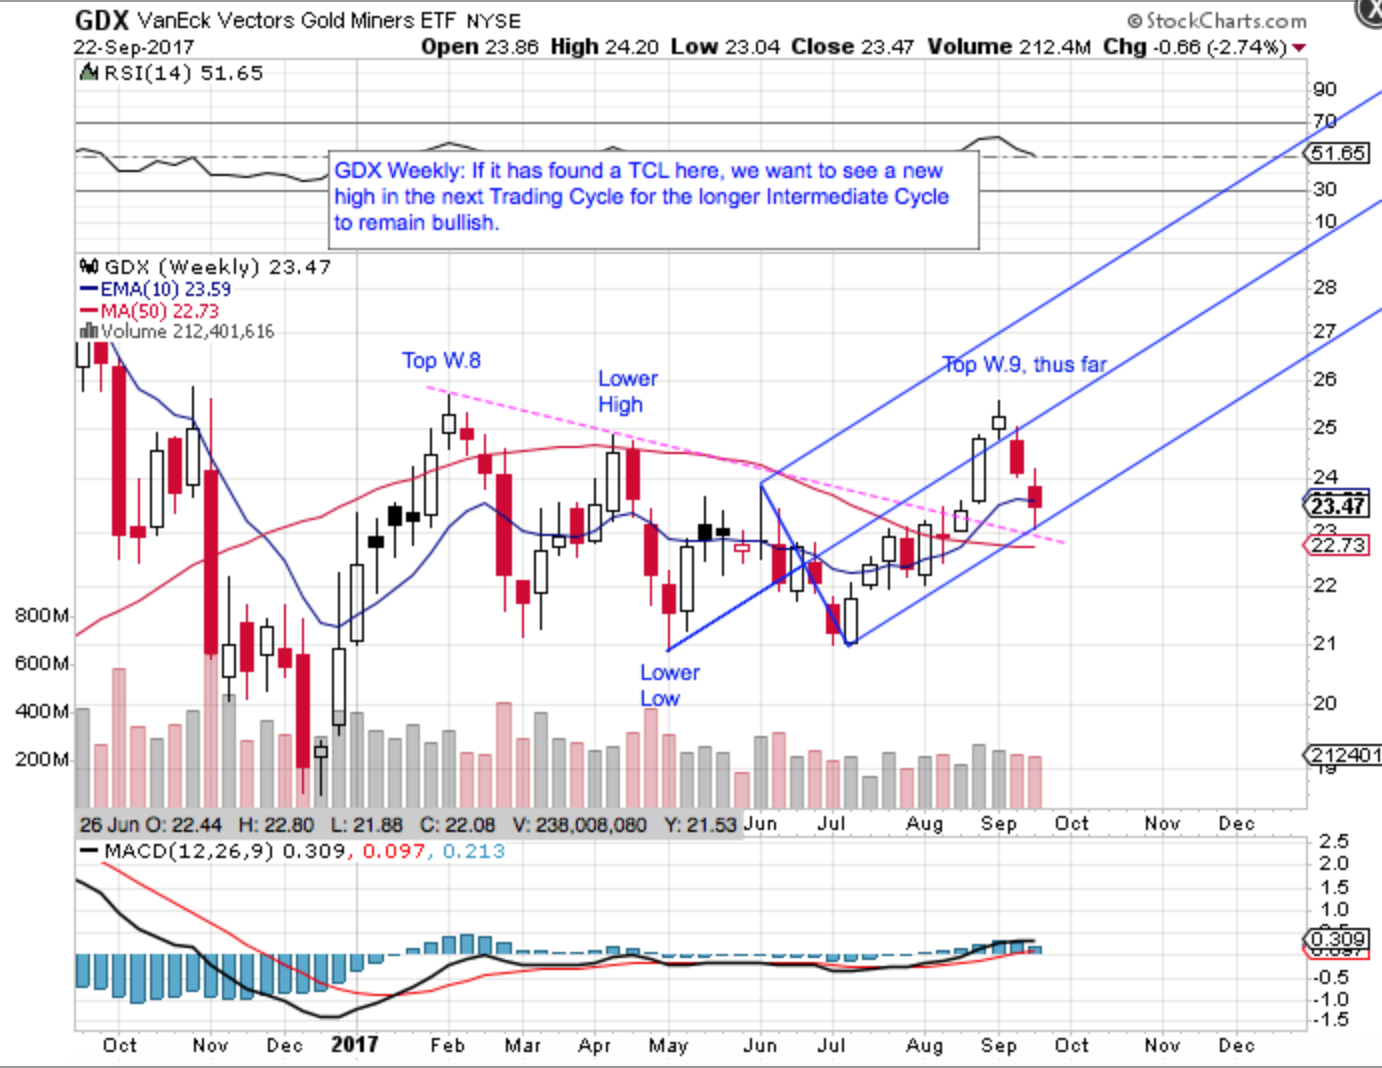
Near term, we won’t know for sure until next week but Gold may have found a TCL last Thursday on day 31. After a top on day 22. we should be nearing a TCL/DCL very soon from. Should Gold move lower next week, my faith in the longer Intermediate Cycle will be shaken. Same with the Miners and Silver. All are at critical support that need to hold over the next few days.
Remember that Gold is the most bullish here and is the only PM to make a new 2017 high in this Intermediate Cycle. Silver and the Miners are still a question mark for me and still have much to prove in the weeks ahead as the next bounce will be into Trading Cycle 3 where most of Gold’s longer Intermediate Cycles top. We want to see all three make higher highs in the next two weeks of TC3 before topping out.
USD:
Cycle Status/Outlook:
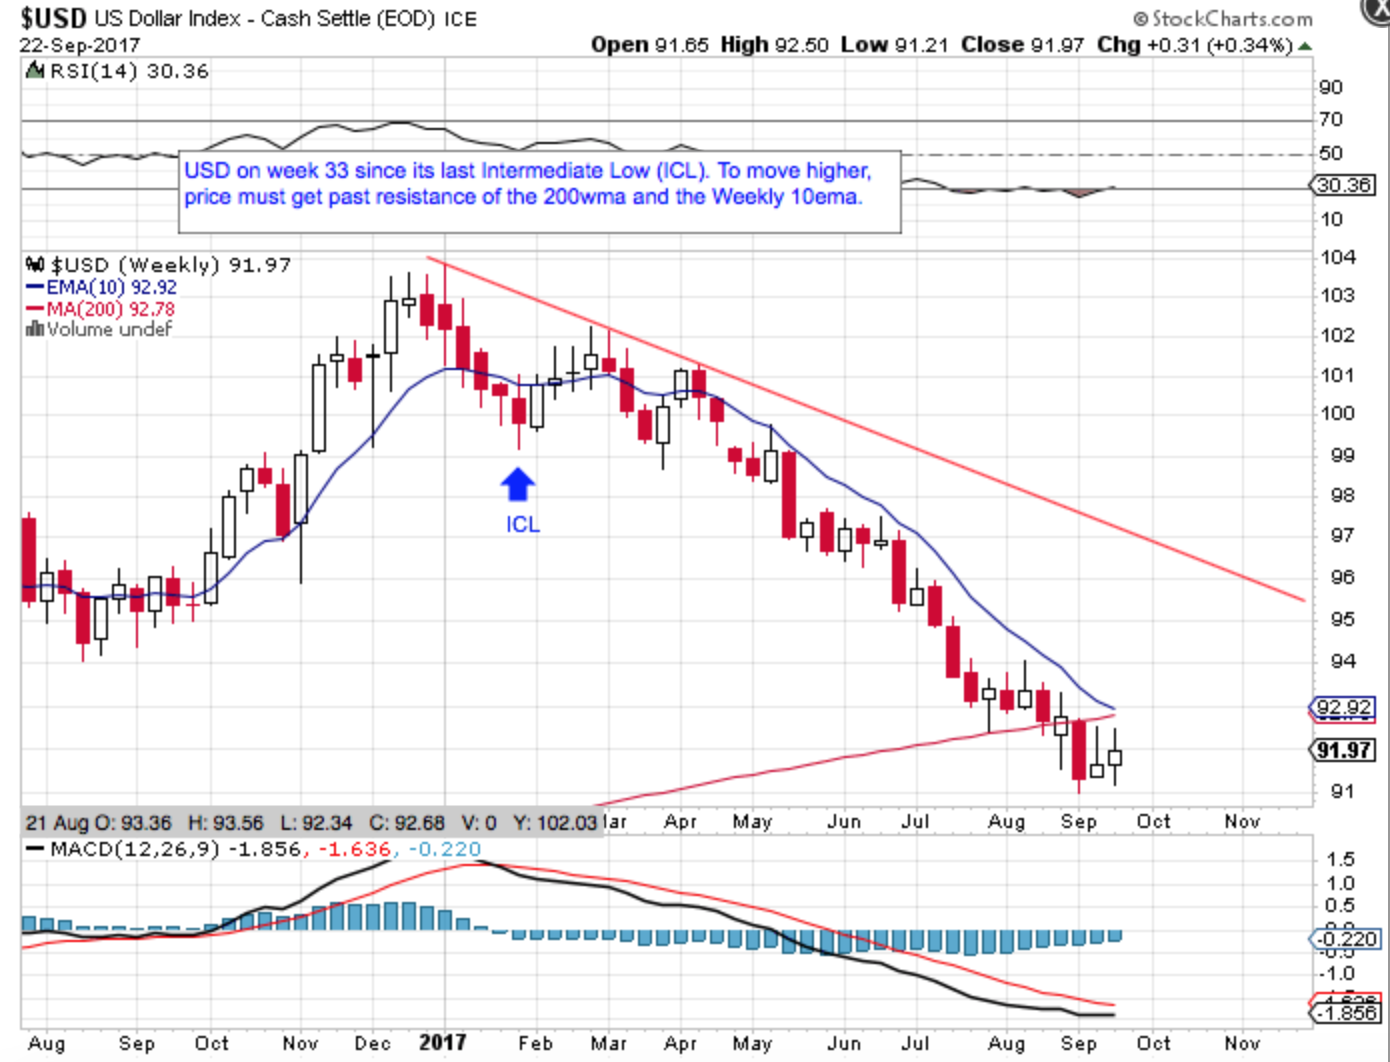
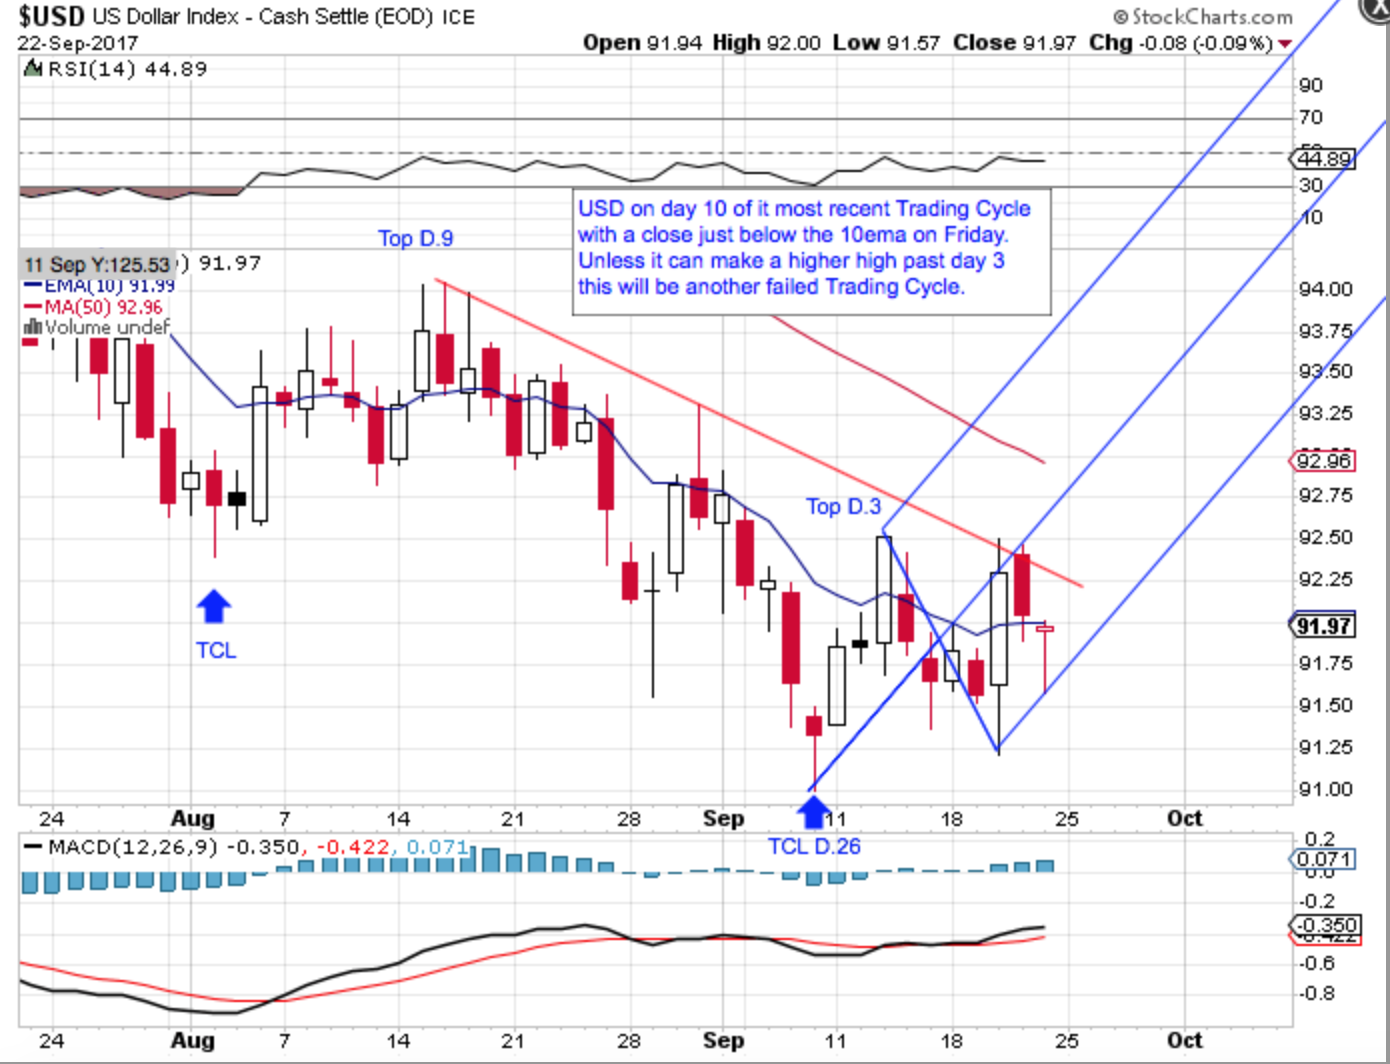
Longer term, my Cycle view is that the USD’s 15 Year Super Cycle has topped and that it should move sideways to lower over the next 5-7 years.
Short term USD is on day 10 of a new Trading or Daily Cycle but lost the 10ema on Friday and needs to recover it quickly or it will roll over into another failed cycle..
Long term I believe the USD found a 15 Year Super Cycle top in early 2017. That said, the USD is overdue to find an Intermediate Cycle low and Yearly low as well. While the next TCL/DCL could also be an ICL, my expectations are that even a rally out of a YCL will be corrective in nature. Strong resistance should be found in the 98.50 to 100 range.
Bitcoin and GBTC:
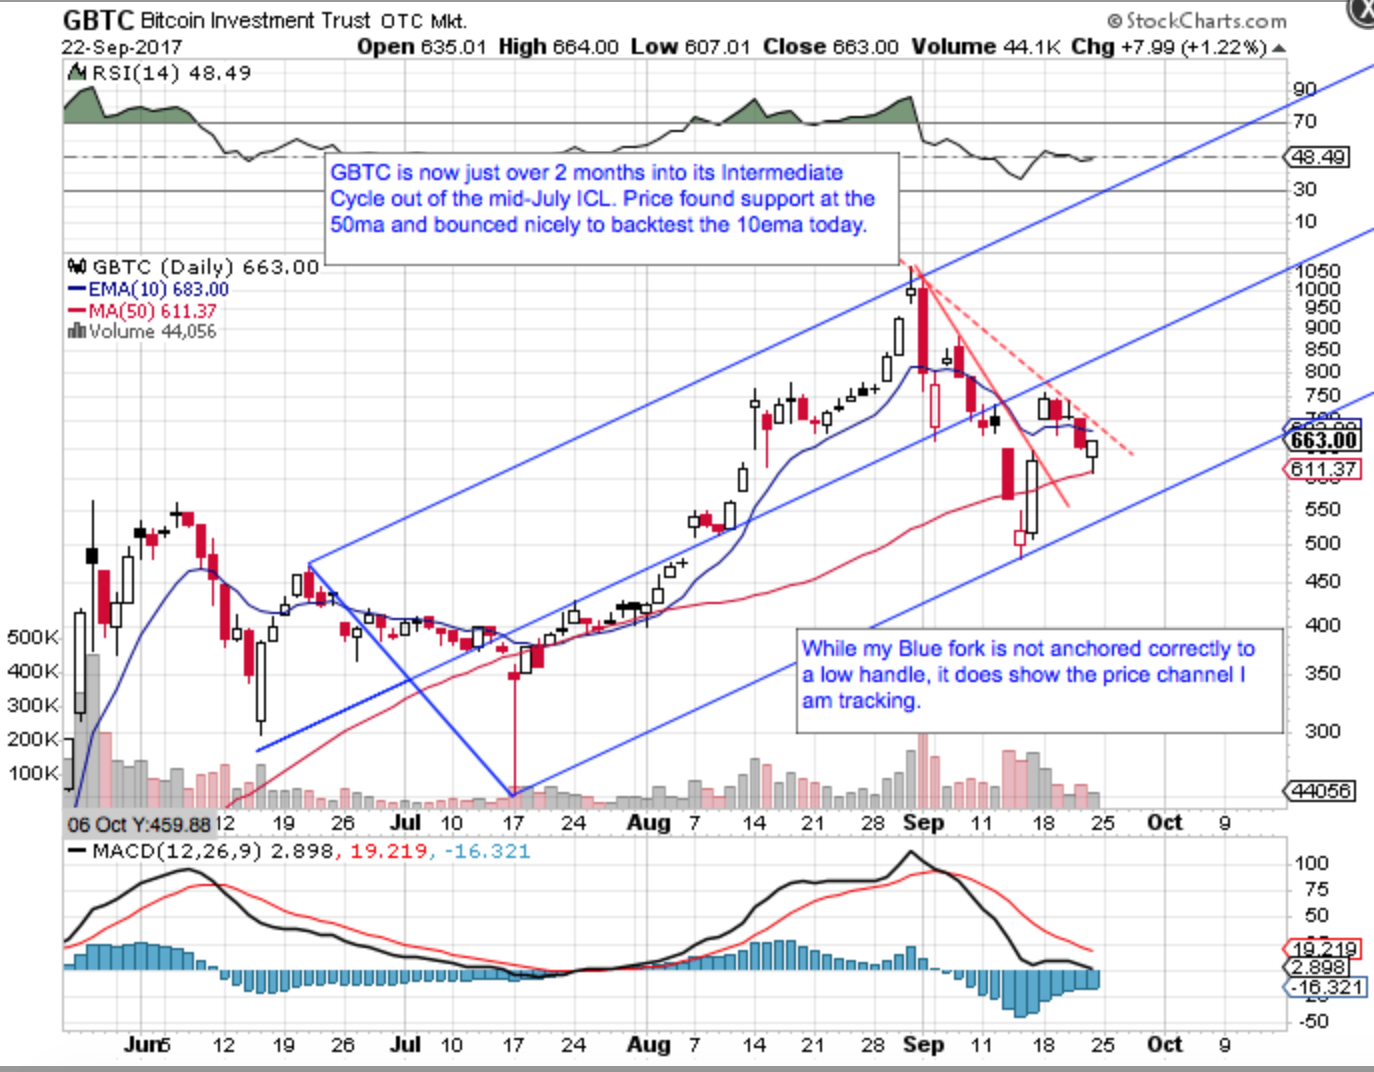
My Cycle view is that BTC is in a wave 5 move top into later this year or early next. Bitcoin Investment Trust (OTC:GBTC) which follows BTC’s lead, will hopefully move higher with BTC.
My shorter count on GBTC is a mess but I don’t think that the BitCoin BTC Intermediate Cycle has topped out just yet. GBTC had a nice bounce off the 50ma which is what I was looking for to stay in the trade.
Bonds:
Cycle Status/Outlook: I am bearish on Bonds (iShares 20+ Year Treasury Bond (NASDAQ:TLT)) and will post more later.
