BoE held rates as widely expected, while MPC voting members also stuck to 7-2 in favour of no action again. Yet despite the lack of fresh dissenters, the BoE signalled they could be on track to raise rates for the first time in ten years.
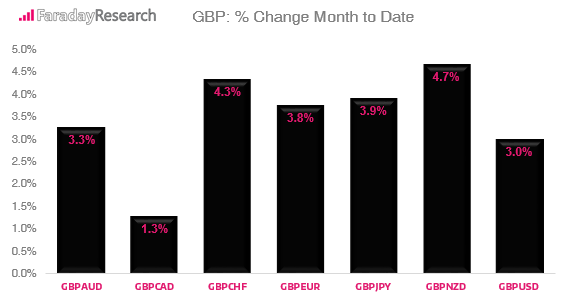
The British Pound extended gains across the board and made notable gains against JPY and CHF. At the time of writing, GBP/JPY is on track for its most bullish week since July 2016 and GBP/CHF its most since November 2016. Furthermore, this rally includes the latest missile launch from North Korea earlier today which Sterling shook off like water from a duck’s back.
Gains this month alone remain impressive and, as we head towards the end of the week, Cable stands firm. Yet we ponder where we can go from here, considering the extended gains are based on words and no action. Remembering that the BoE have performed several U-turns on policy between meetings, it is not impossible to consider that the current rally may have cold water poured over it if they were to do this again. It’s also possible BoE may be using words over action to control inflation, as they know by hinting at a hike and sending GBP higher, it relieves some of the inflationary pressures they remained concerned over. For now, we’ll look at the technical picture on GBP/JPY to see where we stand.
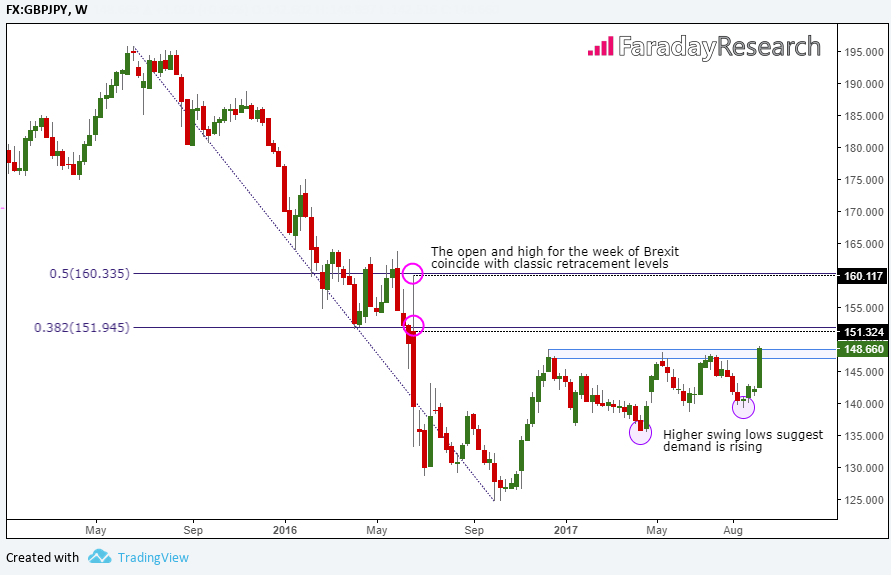
Over the last few hours, GBP/JPY has finally broken above a key zone of resistance. Price action on the weekly chart since the 2016 low does not have the classic hallmarks of a bullish trend, yet to see price test resistance and produce higher lows suggests demand has been slowly building. Today’s breakout could either mark the beginning of a new trading range, or could just as easily close the week lower and be labelled a bull-trap. If the breakout is sustained, our attention is drawn to areas of potential resistance around 151.30 and 160. These areas mark the open and high prices for the week of Brexit and land around 38.2% and 50% retracement levels respectively.
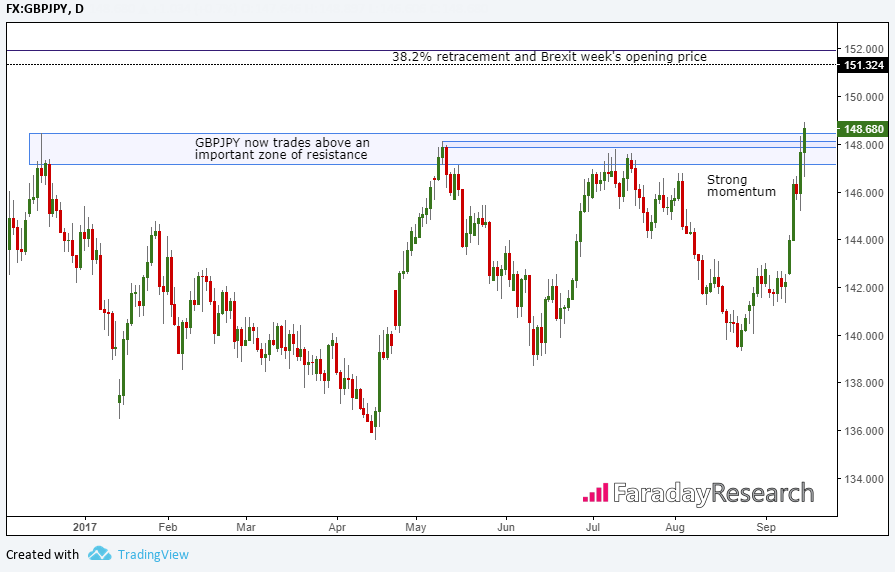
A closer look at the daily chart better shows the impressive, bullish momentum GBP/JPY has seen this week. Retracements have been minor to underscore the strong, bullish trend and there are no obvious signs of price exhaustion are present. Whilst price action currently suggests further upside may be the path of least resistance, we prefer to see evidence of price compression before considering long positions.
As GBP/JPY has rallied over 1% on three separate days this week, the probability of today providing a similar move is much lower in our view. So, as tempting it may be to hop on board the bullish momentum, we err on the side of caution on joining such a move after such elongated candles.
Therefore we would prefer to see signs of compression on the daily chart before considering a long position. This then takes us to next week before we’d consider this currency pair and it also allows us to see if the weekly close can confirm the break, or be labelled a bull-trap.
If, or when prices compress and we seek an opportunity in the 148.46 – 151.32 regions (December 2016 high to Brexit-week’s open price) this allows a range of over 286 pips to consider trading. Until then, we prefer to sit on our hands.


