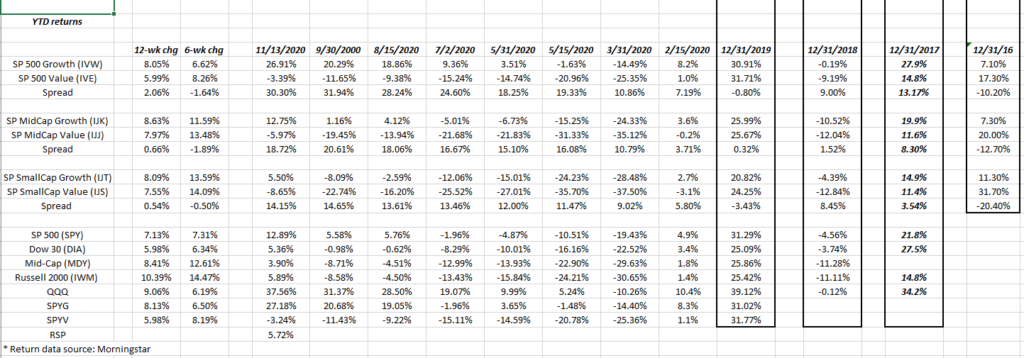
Like the Greek father of the bride in the “Big, Fat Greek Wedding” who believed that pouring Windex on everything was a cure for (and I quote), “from psoriasis to poison ivy,” the spreadsheet is always the “go-to” format for tracking data for this site.

The above spreadsheet calculated with year-to-date returns for the various style-box ETFs, for the first time this quarter shows the 6-week rate-of-change and the 12-week rate of change for those ETFs.
While some will mark the Presidential election (Tuesday, November 3rd, 2020) or the Pfizer (NYSE:PFE) vaccine release (Monday, November 9th, 2020) as the date of the start of the “great rotation,” it’s my belief investors have been seeing the rotation in fits and starts since September 2nd, 2020, when the S&P 500 peaked at 3,885, a level that it’s yet to close back above (although it’s very close).
On Monday, November 9th, the day of the Pfizer vaccine news and the start of what could be the “recovery trade” for the stocks and sectors that didn’t work in the first 9-10 months of 2020, the SPDR® Portfolio S&P 500 Value ETF (NYSE:SPYV) returned +4.17% that day, while the SPDR® Portfolio S&P 500 Growth ETF (NYSE:SPYG) returned -0.49% (per the technical software). Some noted on Twitter that November 9th was the largest single-day outperformance of Value vs Growth ever, but I personally cannot verify that.
First, looking at the above spreadsheet, to the far right, note that small-caps and the “value” style of investing have not beaten the S&P 500 or the large-cap growth style since 2016. If for no other reason than “reversion” to the mean,” it’s probably time the Russell 2000 has a strong absolute and relative return year.
Second, the “great rotation” doesn’t have to be all that great. In other words, when investors do see a rotation it may not necessarily mean that all large-cap growth or the “Big 5” i.e FAAMG need to be sold. We could go through a period of time, perhaps 2021, where large-cap tech and growth simply flat-line and small-cap, mid-cap and “value” add significant absolute and relative return to an individual investor’s portfolio.
Third, within this update for readers, the “6-week” rate of change and “12-week rate of change” have been added so that readers can see rates of change amongst the various style boxes.
1. Note how since 9/30/20 or the end of the 3rd quarter, “value” has outperformed growth amongst all three cap ranges i.e. large, mid and small.
2. Note how mid and small-cap rates of change for the 6-week period exceed the 12-week rate of change while for large-cap style, only value exceeded growth the last 6-week versus 12-week time period. What it tells me is that the most recent 6-week rate of change is accelerating versus the longer 12-week period, for all but large-cap growth, which is starting to underperform.
Summary / Conclusion:
Again, the “great rotation” doesn’t have to mean the collapse of the Top 5 names in the S&P 500. It could simply mean that large-cap growth and Tech and many of the names seeing multiple expansion with the COVID-19 lockdown, spend a year consolidating the gains of the last 4-5 years, as the under-performing styles and sector laggards like Financials and Energy play a little catch-up.
One huge mess we've sidestepped for readers and clients is the avoidance of the Energy sector entirely since early 2017. Off the Q1 ’16 market lows, Energy estimates were seeing positive, upward, revisions for several quarters and so we owned the Energy Select Sector SPDR® Fund (NYSE:XLE) for clients, but ultimately sold at $65 or so.
One single statistic has kept Energy out of client portfolio’s the last 10 years (for the most part) and that was the statement by the International Energy Agency (IEA) that 50% of the demand for US crude was gasoline distillation driven. Watching more and more Teslas on Chicago roads and talking to energy traders at the CME (Chicago Merc) many of whom thought—even at that time—that the world was awash in oil, kept me out of a sector that I didn’t intuitively understand anyway.
The next update of this style-box post, will be New Year’s weekend or that holiday break.
The style-box post is updated every 6 weeks, or at the end of each quarter and then in the middle of the quarter, as this weekend represents for Q4 ’20.
Take anything read here with skepticism and remember opinions can and often must change quickly in this business.
