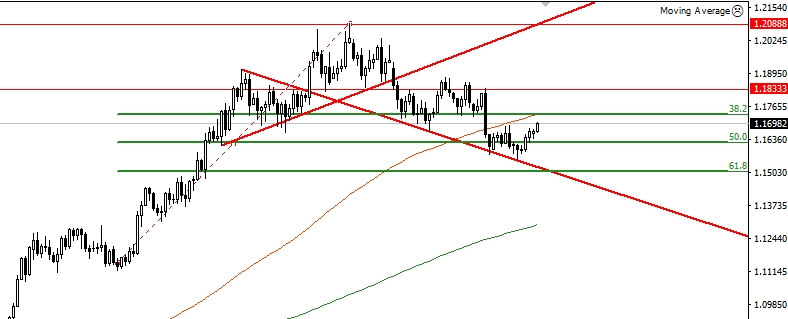
The EUR/USD pair has been rallying higher for the last 5 months but eventually found extensive selling pressure near the critical support level at 1.2088.From the level, the sellers have managed to push this pair downward and managed to breach the medium term bullish trend line support level at 1.18613.A daily closing of the price below the critical support level at 1.18613 is a significant sign of bearish retracement after the long extensive bullish rally. However, the pair has managed to found some solid support at 1.15497 and preparing for another bullish run. Most of the professional price action traders have already gone long in the EUR/USD pair with the formation of bullish pin bar near the 50% Fibonacci retracement level dram from the low of 20th June 2017 to the high of 8th August 2017.
Figure: EUR/USD pair heading towards the 100 days SMA in the daily chart
From the above figure, you can clearly see that the pair has found some fresh buying pressure after hitting the critical support level at 1.15497.Though we had an initial breach of the 50% retracement level in the daily chart but the bulls are now taking control of this market with full thrust. Currently, the pair is heading towards the 100-day dynamic resistance level at 1.17272 and a daily closing of the price above that level will confirm the initial bottom formation of this pair at 1.15497.
If the pair manages to break the 100-day dynamic resistance level then we are most likely to see an extensive bullish rally in the EUR/USD pair. However, the expert investors in the Forex trading industry will be cautiously observing the movement of EUR/USD pair for this week as the sellers might come back again into this market. In the daily time frame, the overall scenario will stay bullish as long as the 61.8% Fibonacci retracement level manages to hold the price. But a daily closing of the price below the 61.8% Fibonacci retracement level will turn the initial bias from bullish to bearish.
EUR/USD weekly chart analysis
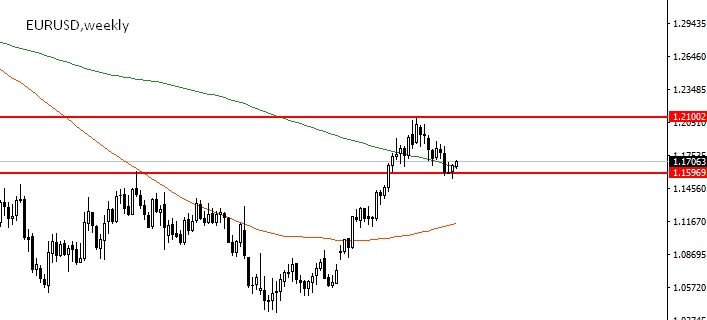
Figure: EUR/USD pair finding fresh buying pressure near the weekly support level
In the weekly time frame, the overall bias for the EUR/USD pair remains extremely bullish. From the above figure, you can clearly see that the price has formed nice bullish pin near the critical support level 1.15969.Though we had an initial breach of the weekly support level, the bulls eventually managed to push the price higher prior to the closing of the trading week. Currently (3 PM GMT +6) the price trading above the 200 weekly SMA which clearly signifies the buyers are dominating the market. The recent downfall of the EUR/USD pair after hitting the critical resistance level at 1.21002 level is now being considered as a corrective pattern for the recent bullish rally.
The U.S dollar index which measures the overall value of the green bucks strength is also facing an extreme level of selling pressure after it rejects the critical resistance level at 95.00.Most of the leading investors are expecting a strong downfall in the U.S dollar index towards the critical support level at 93.50 marks which will ultimately result in a strong bullish rally in EUR/USD pair. Though the Euro bulls are dominating the market at the current moment on the scheduled press conference on the upcoming Friday ECB president, Mario Draghi is going to deliver his speech. A strong hawkish speech will definitely boost the Euro bulls in the global market and the dovish statement will exhaust the buyers. Moreover, FED chairperson Janet Yellen will also deliver her speech regarding their next rate hike and this event is most likely to create a high level of market volatility.
Considering all the parameters, the overall bias for the EURUSD pair remains strong bullish as long the 61.8% Fibonacci retracement level holds. A drop in the price below that level will create fresh selling pressure to this pair.

