Get 40% Off
👀 👁 🧿 All eyes on Biogen, up +4,56% after posting earnings. Our AI picked it in March 2024.
Which stocks will surge next?
Unlock AI-picked Stocks

Strong Friday Finish Proves Market Resilience In Face Of Bad News

Published 01/07/2019, 12:13 AM
Updated 07/09/2023, 06:31 AM

Friday was the finish markets needed to offset the losses from Apple's (NASDAQ:AAPL) earlier in the week earnings release. Once again, markets proved resilient in the face of bad news and this is bullish. Those who have been buying the oversold (investor) signals can continue to do so. With the move towards the 200-day MA the strength of the investor 'buy' signals weakens; so those buying on the 12-month window can slow to once a month until the next leg down begins.

For the S&P, Friday's gain built support for the MACD trigger 'buy' although it lost relative strength against the Russell 2000. Other technicals remain negative as Monday will see its first test of the 20-day MA (soon to be followed by a test of its 200-day MA) and support lows from the October-December period.
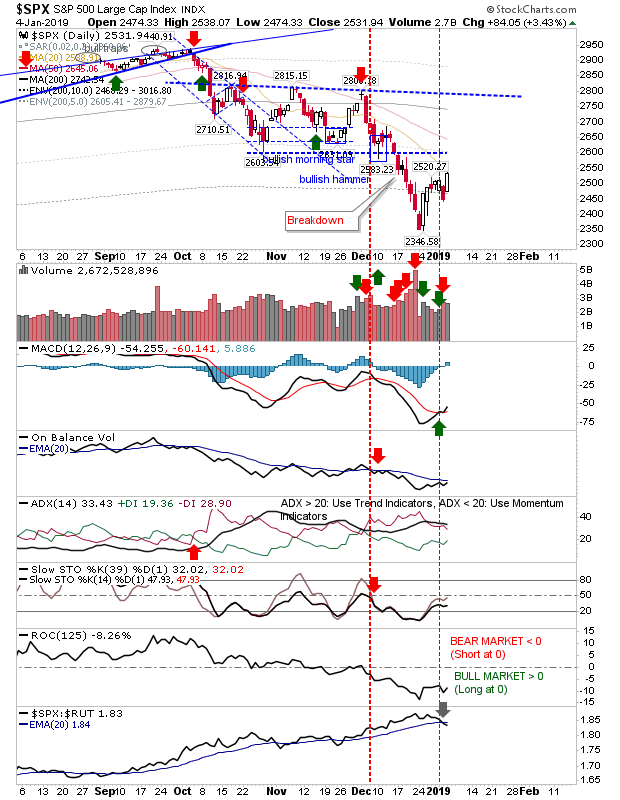
SPX Daily Chart

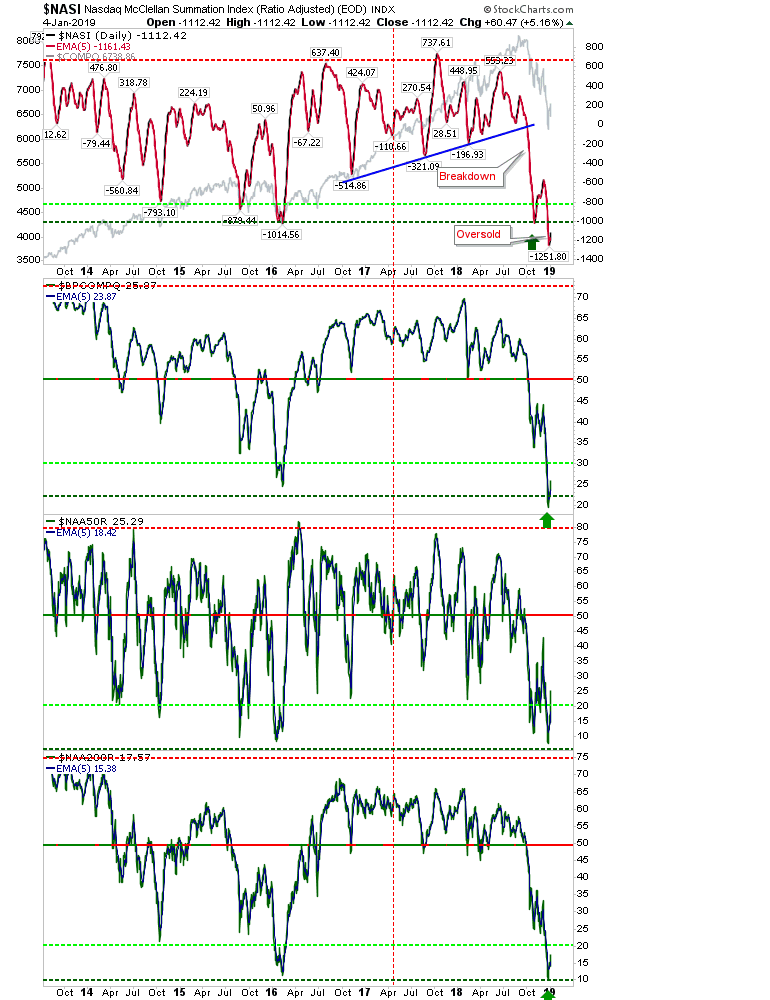
The best one day gain came from the NASDAQ. Along with a relative performance gain against the S&P, and an expansion of the 'buy' signals in the MACD and On-Balance-Volume, the gain in the index will have wiped out any shorts who may have jumped on Friday's weakness. Next up is the 20-day MA.
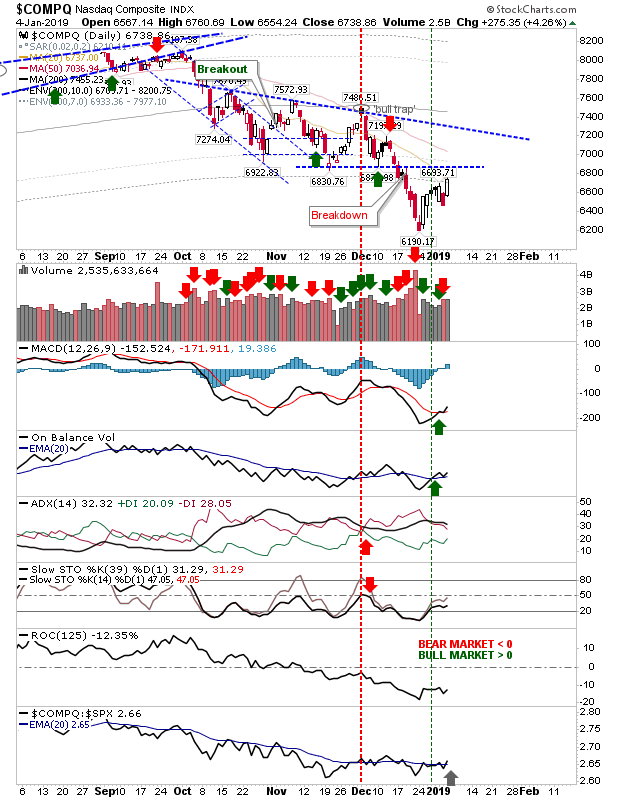
COMPQ Daily Chart

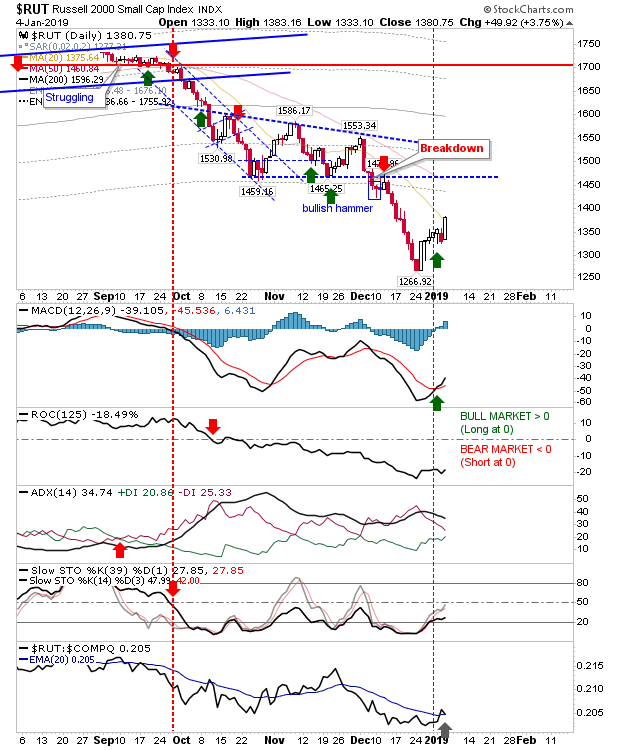
The Russell 2000 has the most room to run before challenging supply from October-November. Unlike the S&P and NASDAQ it has managed to cross above the 20-day MA. There was a relative performance gain against these indices and this should encourage money flow into more speculative Small Cap stocks - another sign that a significant swing low is in place. There is still much work to do but it's a good start.
3rd party Ad. Not an offer or recommendation by Investing.com. See disclosure here or remove ads .

RUT Daily Chart

In other charts, the relationship between the Dow Index and Transports accelerated to new lows. Next support levels are at 0.36, 0.35 and 0.30.
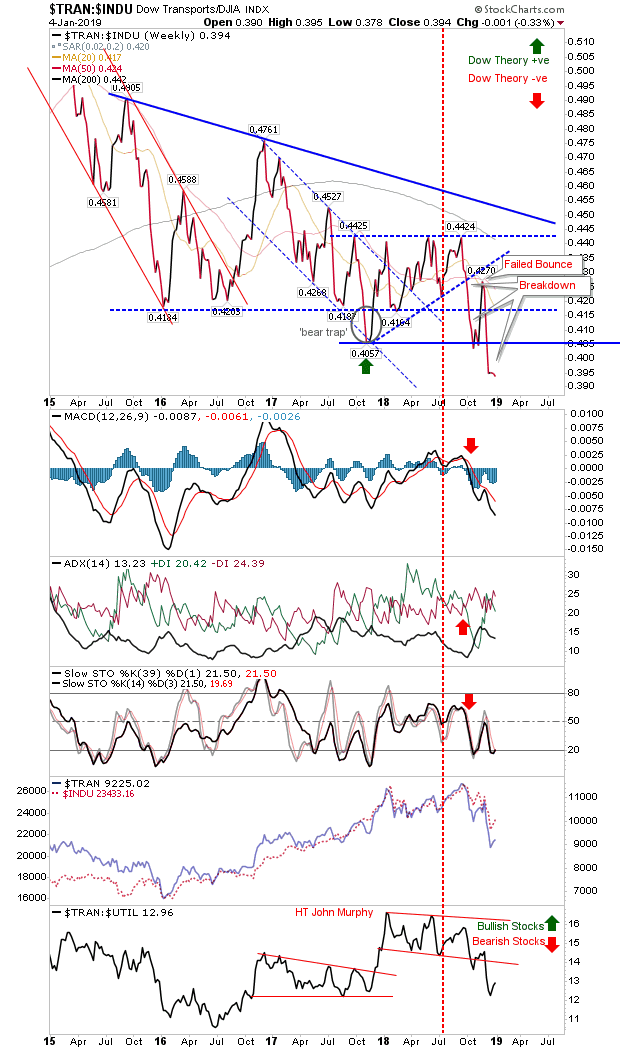
TRAN:INDU Weekly 2015-2019

NASI Daily Chart

Another look at the significance of the percentage of NASDAQ stocks above the 200-day MA; it tagged the 2011 level.
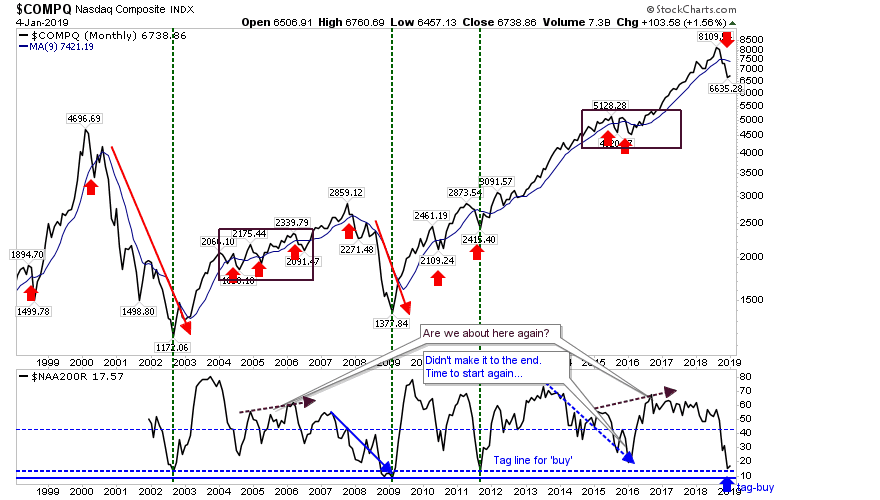
COMPQ Monthly 1998-2019

The EMA of new lows spiked at new highs (again surpassing the extremes of 2016)—another tick in the major low category.
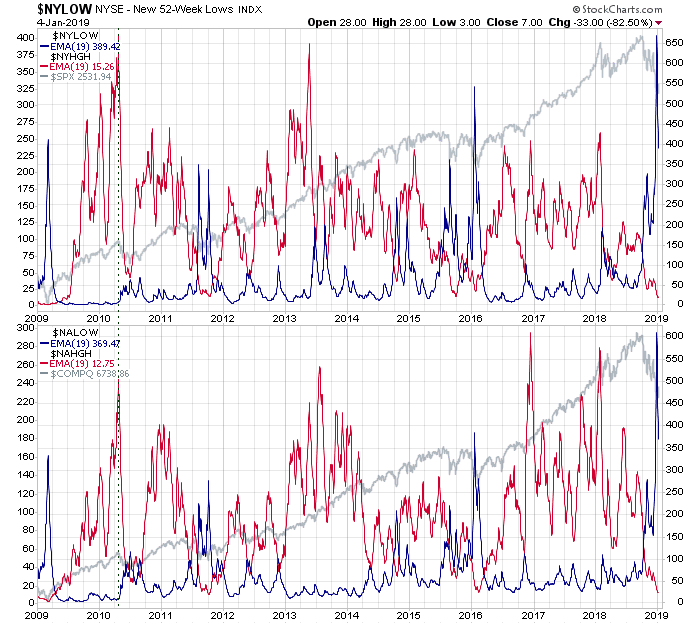
NYLOW Chart

For this week, look for a challenge inside the Oct-Dec congestion level. Shorts can look to attack this test but this bounce has managed to shrug off bad news fairly easily—so there is a high chance of failure for such trades.

Latest comments

Risk Disclosure: Trading in financial instruments and/or cryptocurrencies involves high risks including the risk of losing some, or all, of your investment amount, and may not be suitable for all investors. Prices of cryptocurrencies are extremely volatile and may be affected by external factors such as financial, regulatory or political events. Trading on margin increases the financial risks.
Before deciding to trade in financial instrument or cryptocurrencies you should be fully informed of the risks and costs associated with trading the financial markets, carefully consider your investment objectives, level of experience, and risk appetite, and seek professional advice where needed.
Fusion Media would like to remind you that the data contained in this website is not necessarily real-time nor accurate. The data and prices on the website are not necessarily provided by any market or exchange, but may be provided by market makers, and so prices may not be accurate and may differ from the actual price at any given market, meaning prices are indicative and not appropriate for trading purposes. Fusion Media and any provider of the data contained in this website will not accept liability for any loss or damage as a result of your trading, or your reliance on the information contained within this website.
It is prohibited to use, store, reproduce, display, modify, transmit or distribute the data contained in this website without the explicit prior written permission of Fusion Media and/or the data provider. All intellectual property rights are reserved by the providers and/or the exchange providing the data contained in this website.
Fusion Media may be compensated by the advertisers that appear on the website, based on your interaction with the advertisements or advertisers.
© 2007-2024 - Fusion Media Limited. All Rights Reserved.