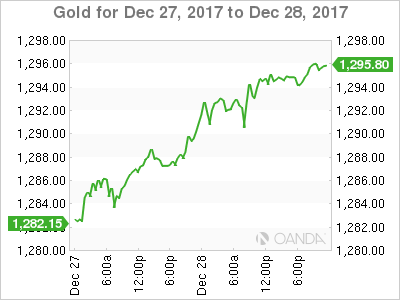
Gold continues to move higher during Christmas week, and has climbed to its highest level since the end of November. In Thursday’s North American session, the spot price for an ounce of gold is $1294.44, up 0.56% on the day. On the release front, Thursday's key indicator was unemployment claims, which remained unchanged at 245 thousand. This was higher than the estimate of 240 thousand.
The US dollar is broadly lower on Thursday, and gold has taken full advantage, posting considerable gains. Gold has jumped 3.0% percent since December 11, and is within striking distance of the symbolic $1300 level, which was last breached in late October.
In the U.S, the first key indicators of the holiday week were mixed. CB Consumer Confidence slowed to 122.2, well off the estimate of 128.2 points. Pending Home Sales posted a small gain of 0.2%, beating the estimate of -0.4%. Housing numbers continue to beat expectations. Last week, Housing Starts came in at 1.30 million, beating the forecast of 1.25 million. On Tuesday, New Home Sales sparkled, with a gain of 733 thousand. This easily beat the estimate of 654 thousand, and was the highest reading since September 2007. On Thursday, the US releases unemployment claims, which is expected to drop to 241 thousand.
US housing numbers continue to beat expectations, as Pending Home Sales surprised the markets with a gain of 0.2%. Last week, Housing Starts came in at 1.30 million, beating the forecast of 1.25 million. On Tuesday, New Home Sales sparkled, with a gain of 733 thousand. This easily beat the estimate of 654 thousand, and was the highest reading since September 2007. On Thursday, the US releases unemployment claims, which is expected to drop to 241 thousand.
XAU/USD Fundamentals
Thursday (December 28)
- 8:30 US Unemployment Claims. Estimate 240K. Actual 245K
- 8:30 US Goods Trade Balance. Estimate -67.7B. Actual -69.7B
- 8:30 US Preliminary Wholesale Inventories. Estimate 0.4%. Actual 0.7%
- 9:45 US Chicago PMI. Estimate 62.2. Actual 67.6
- 10:30 US Natural Gas Storage. Estimate -115B. Actual -112B
- 11:00 US Crude Oil Inventories. Estimate -3.9M. Actual -4.6M
*All release times are GMT
*Key events are in bold
XAU/USD for Thursday, December 28, 2017

XAU/USD December 28 at 12:15 EST
Open: 1287.21 High: 1295.19 Low: 1287.06 Close: 1294.03
XAU/USD Technical
| S3 | S2 | S1 | R1 | R2 | R3 |
| 1240 | 1260 | 1285 | 1307 | 1337 | 1375 |
- XAU/USD posted slight gains in the Asian and European sessions. The pair is steady in North American trade
- 1285 is providing support
- 1307 is the next resistance line
- Current range: 1285 to 1307
Further levels in both directions:
- Below: 1285, 1260, 1240 and 1213
- Above: 1307, 1337 and 1375
OANDA’s Open Positions Ratio
XAU/USD ratio is showing movement towards short positions. Currently, long positions have a majority (60%), indicative of trader bias towards XAU/USD continuing to move to higher ground.
