Friday certainly wasn’t the most impressive rally, given Thursday’s steep decline.
S&P 500
The S&P 500 index in typical fashion gapped higher by about 2.5% to start the day, only to give it back by mid-morning. The goods news is that the index did test that critical 3,000 level a couple of times throughout the day and held that level for now. A buy imbalance of about $2 billion for the closing cross helped to boost the index into the close and saved the day.
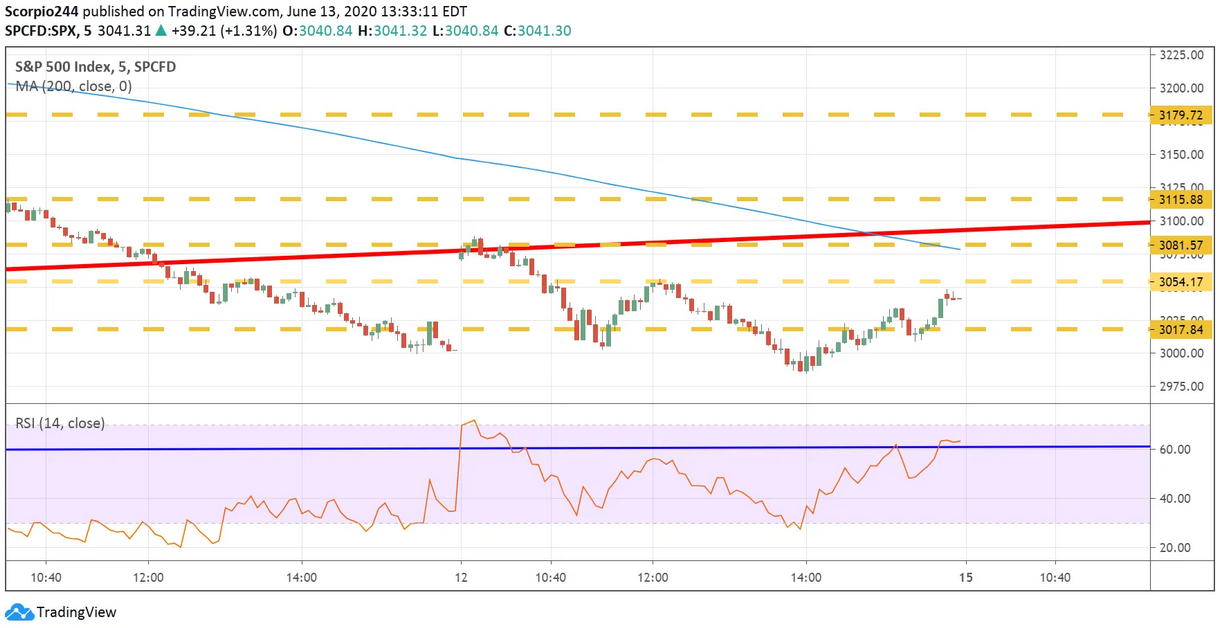
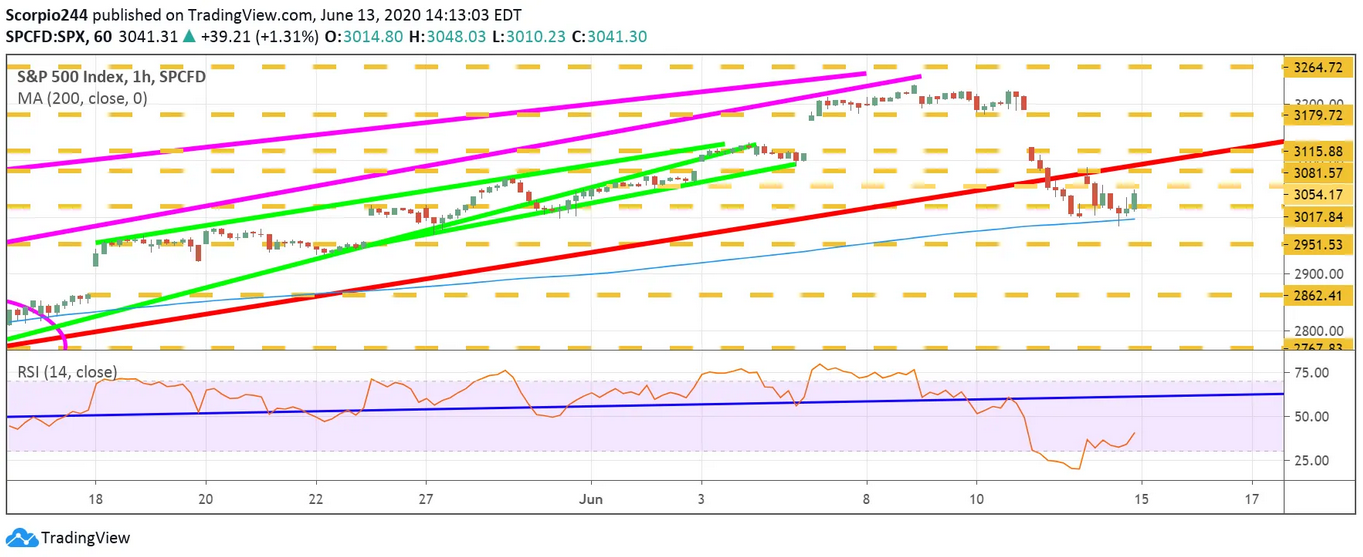
What I do find kind of interesting is how the S&P 500 managed to retest the uptrend it broke on Thursday and then failed. That could be a sign a further move lower lies ahead. Additionally, the RSI uptrend broke as well, and that is never a good sign.
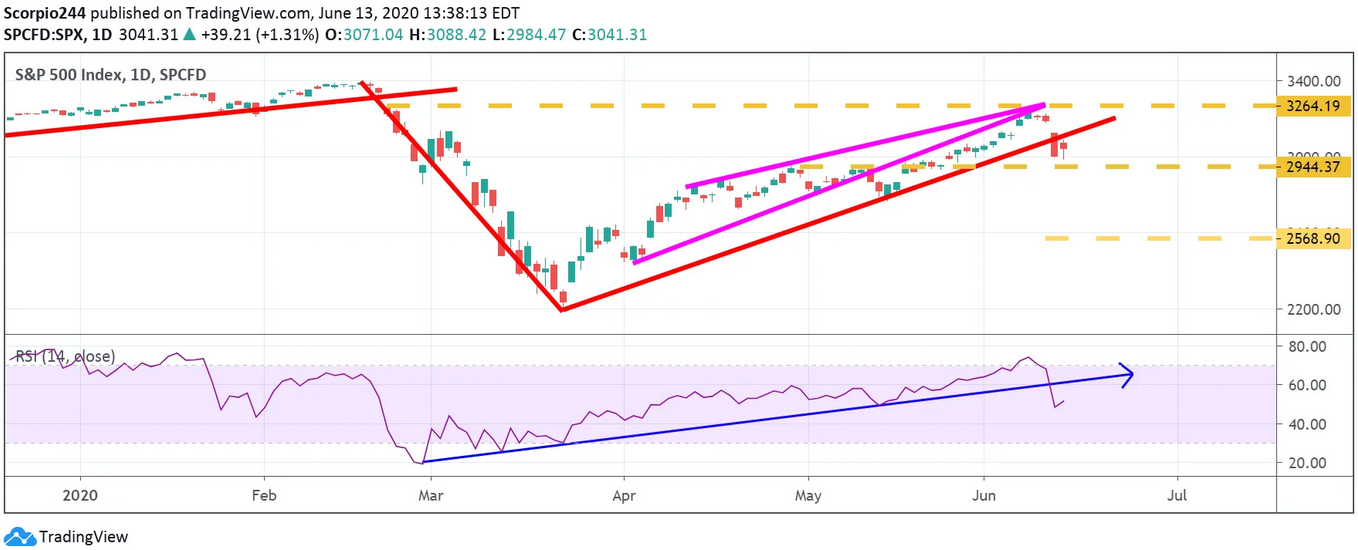
Fundamentally, there is nothing to support this market from a valuation perspective. From a liquidity perspective, it seems that QE will continue at a much slower pace then policy outlined in March. That really can spell trouble for an index trading at very high valuation levels. From a pure PE perspective, assuming a 17 multiple on my 2021 earnings estimates of $157.63, the index may only be worth 2,680.
Remember, this is not 2019, where we entered the year with a below-average market multiple, and an economy that was growing nicely. This is a market that is trading with a very high earnings multiple, in a very uncertain economy. Even worse, is that there is a tremendous amount of uncertainty around those earnings estimates.
The S&P 500 enters what could be a wild week, with quadruple witching and the S&P 500 rebalancing. There is a giant gap to fill at 2,860.
Netflix
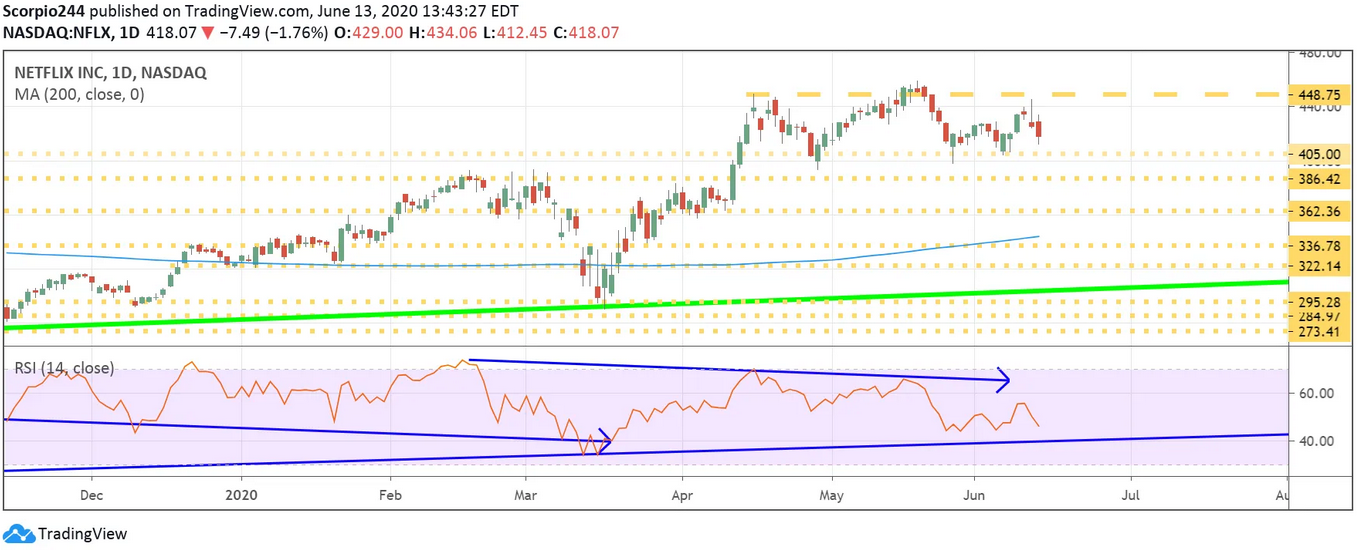
Netflix (NASDAQ:NFLX) does appear to be forming that head and shoulders pattern, which I noted at the end of the week. The stock still needs to fall below $400 to confirm the pattern, but it could open up a more significant move lower towards $360.
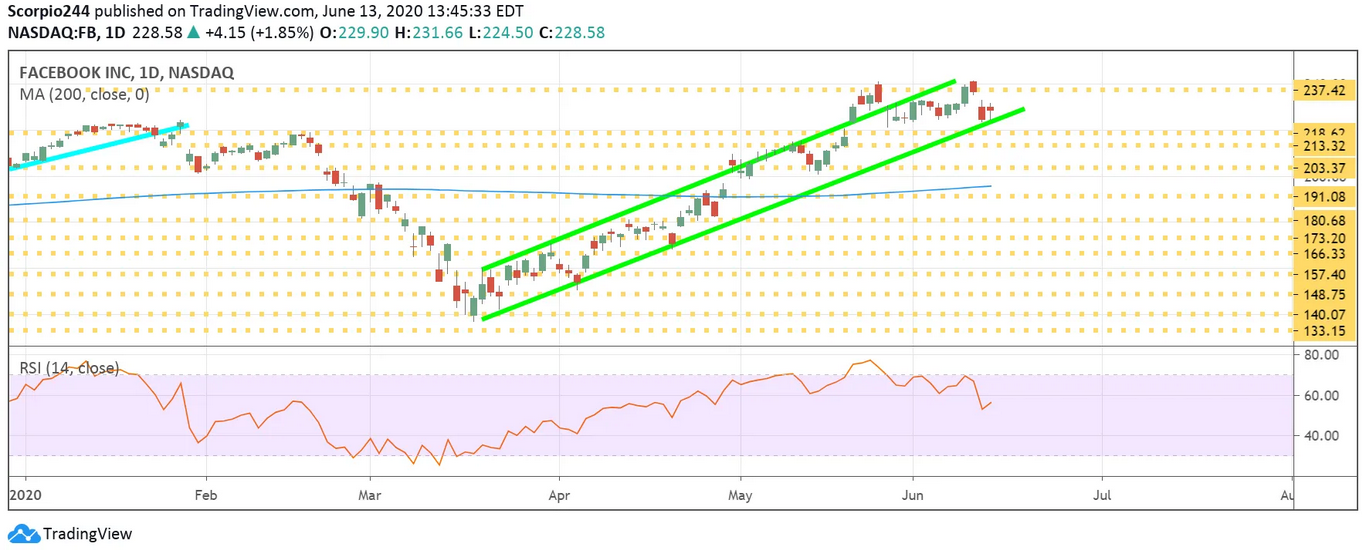
Facebook (NASDAQ:FB) appears to have formed a double top pattern and needs to fall below $218 for confirmation.
AMD
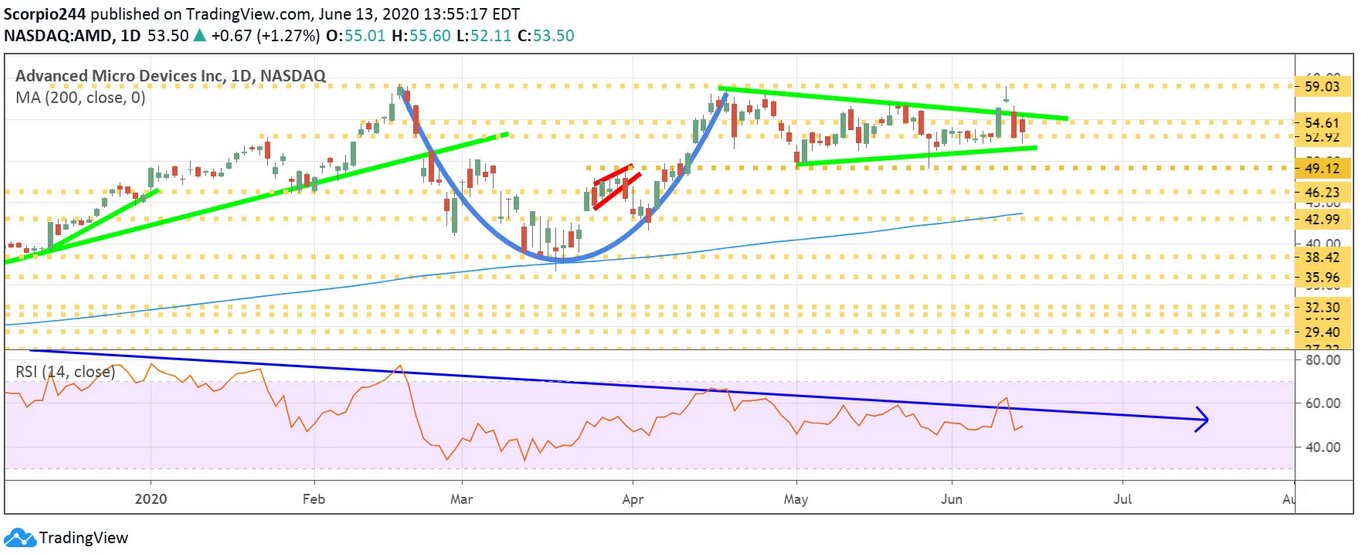
I had thought there was a chance that Advanced Micro Devices (NASDAQ:AMD) was forming a cup and handle pattern, and it had seemed the stock broke out on Wednesday. But then it failed at resistance and moved back to support around $52. Now, it could just as easily be forming a descending triangle, and the potential for the shares to fall to $49.
Twilio
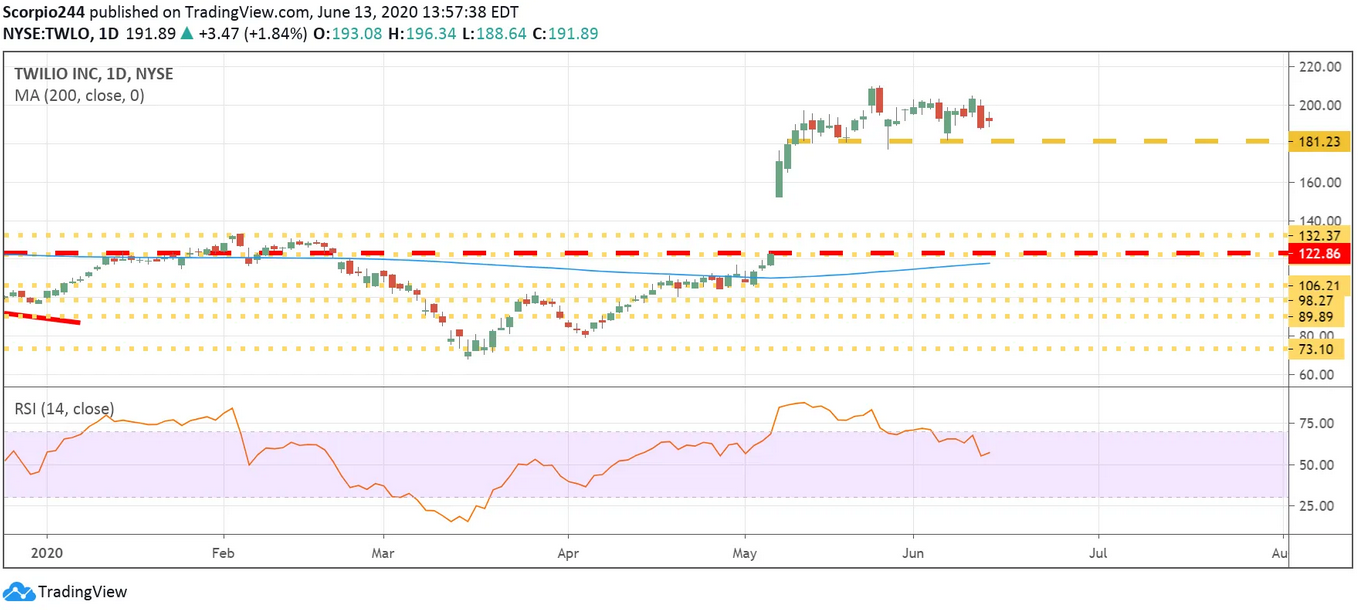
When is this Twilio (NYSE:TWLO) just going to break already, and move lower? It just keeps hanging around.
Home Depot
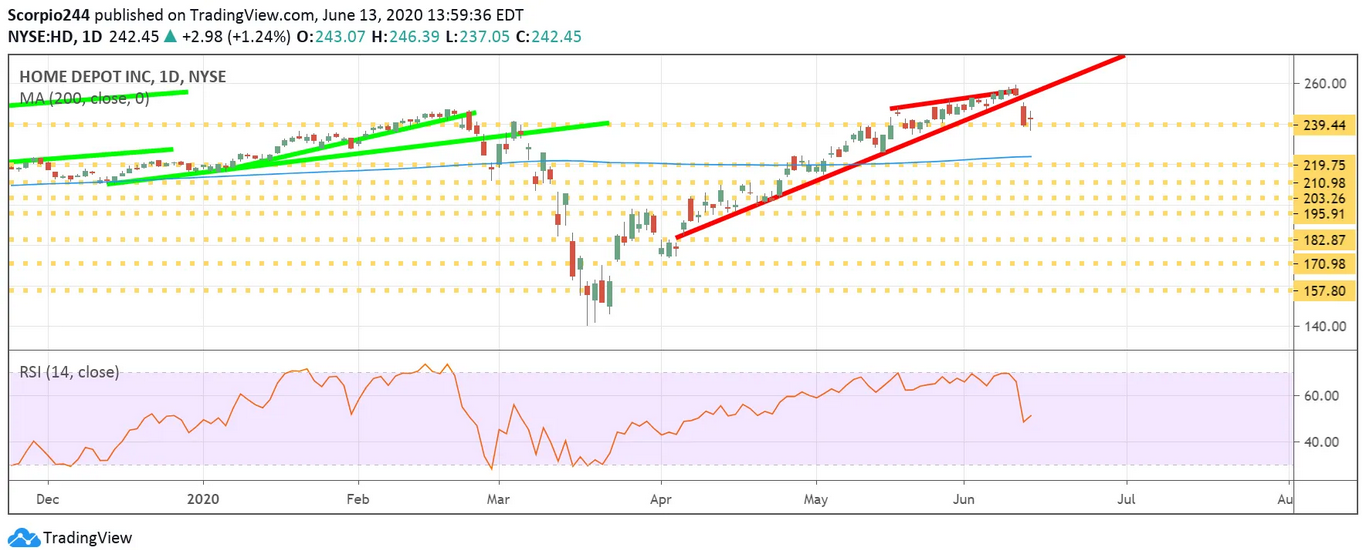
Home Depot’s pattern broke on Thursday, and the next stop could easily be $220.
