There has been a bit of a rotation trade taking place in the market, and that is resulting in these diverging indexes. The Nasdaq 100 is weaker yesterday, falling by about 50 bps, while the S&P 500 is up about 39 bps. As I discussed this afternoon in the midday, we have strength in industrials and energy offset weakness in Technology and communications. The sad thing is that it takes a gain of 2.4% in the industrials to offset a decline of just 50 bps from Technology. It tells you how things could go for the big indexes should the pace of the industrial sector’s gains merely slows. Again, this just has to do with the construction of the S&P 500 index itself.
NASDAQ 100 ETF
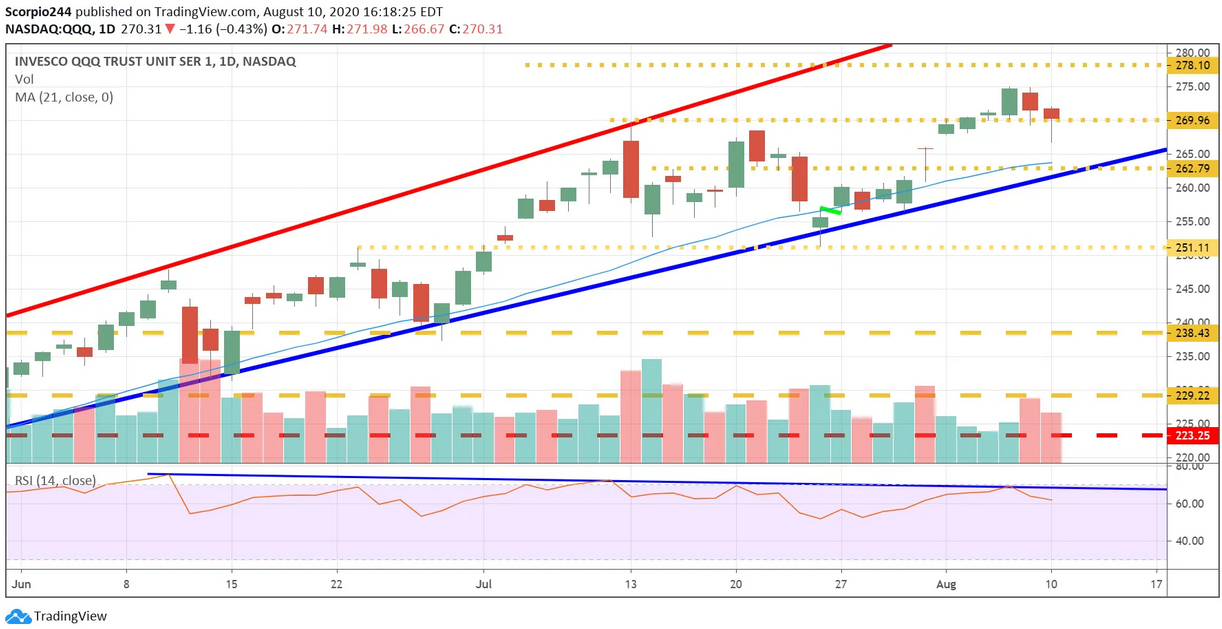
It is the reason why I have refocused so much time to watching the Invesco QQQ Trust (NASDAQ:QQQ) than the SPDR S&P 500 (NYSE:SPY). At the end of the day, if momentum to the sell-side begins to gain meaningful traction, the S&P 500 is going to go with the NASDAQ, like it or not.
For now, it would seem that $275 is the top for the Qs and are we beginning to see a pattern of lower highs and lower lows. I think the Qs are heading lower towards the $263-265 region. Additionally, we are starting to see an uptick in volume on the Qs, which is likely a sign that more sellers are setting into the market.
S&P 500 ETF
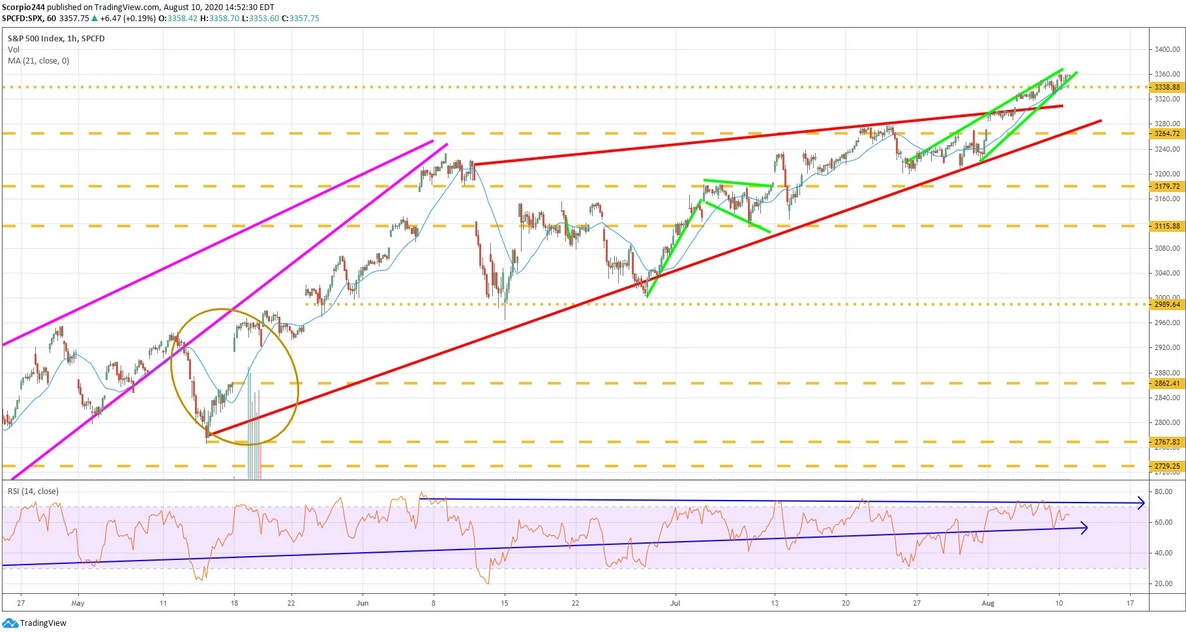
It seems there is a wedge that has formed within the wedge of the S&P 500. It could suggest that the end of this upturn is not only near but likely here.
AMD
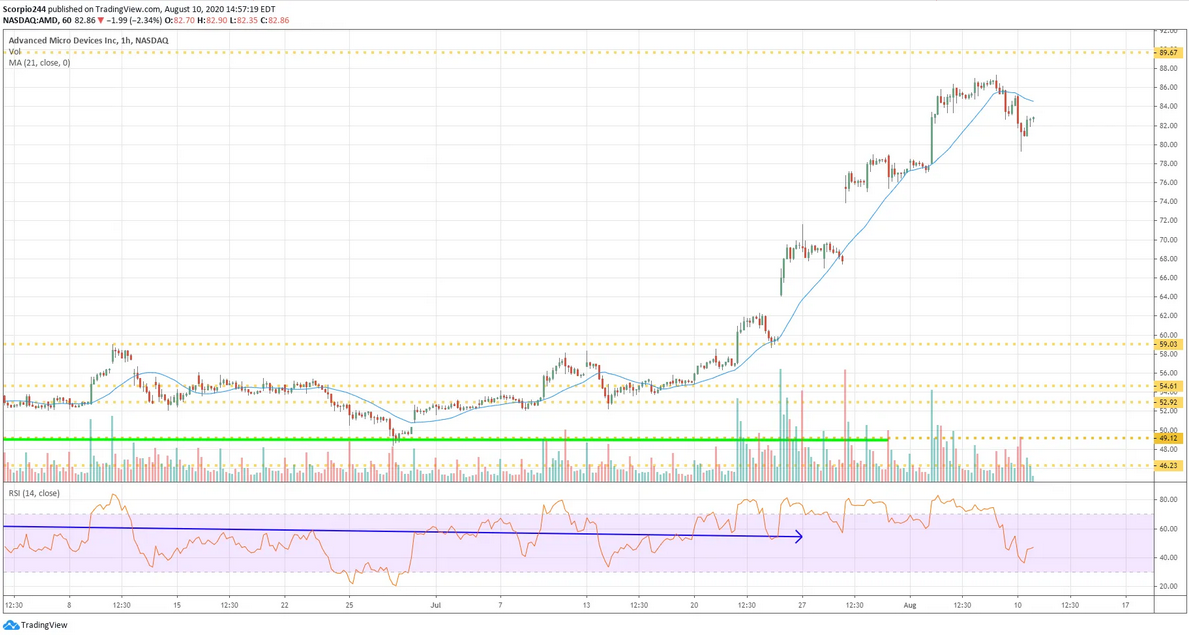
AMD did not have a great day on Monday falling by more than 3%. I saw some bearish betting on this one, meanwhile, there are a bunch of gaps that needed to be filled. I think in meantime the stock is likely heading lower, but the gap fills may be too far for now. For now, I’m targeting $78.
Netflix
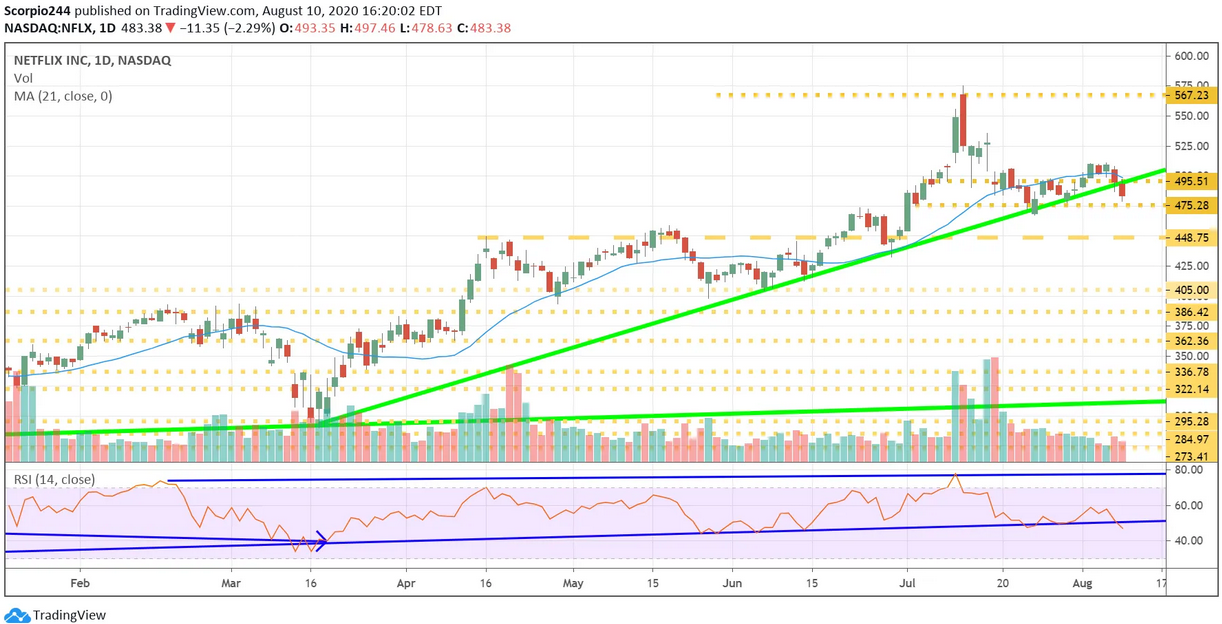
We have focused so much on these big tech-related names, and at least for now, Netflix (NASDAQ:NFLX) appears to be the first of them to break uptrend off the March lows. A decline below $475, triggers a further decline to around $450.
Microsoft
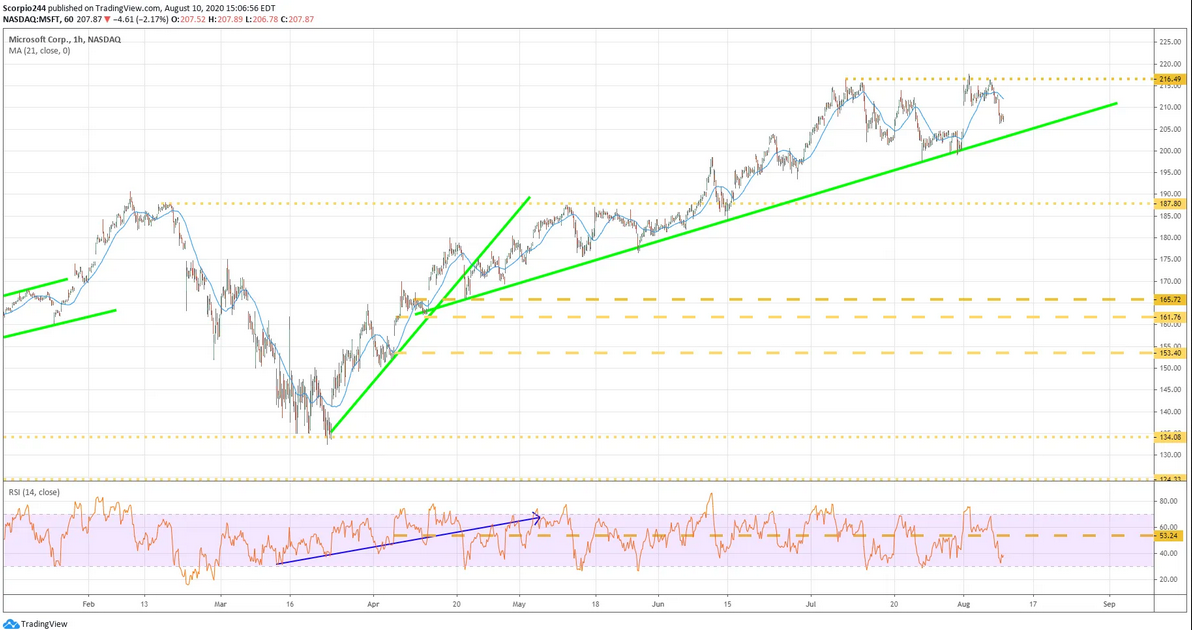
Microsoft (NASDAQ:MSFT) has failed at resistance at $216, and for now, appears to be filling a gap at $205.That is where a big test at the uptrend awaits.
FedEx
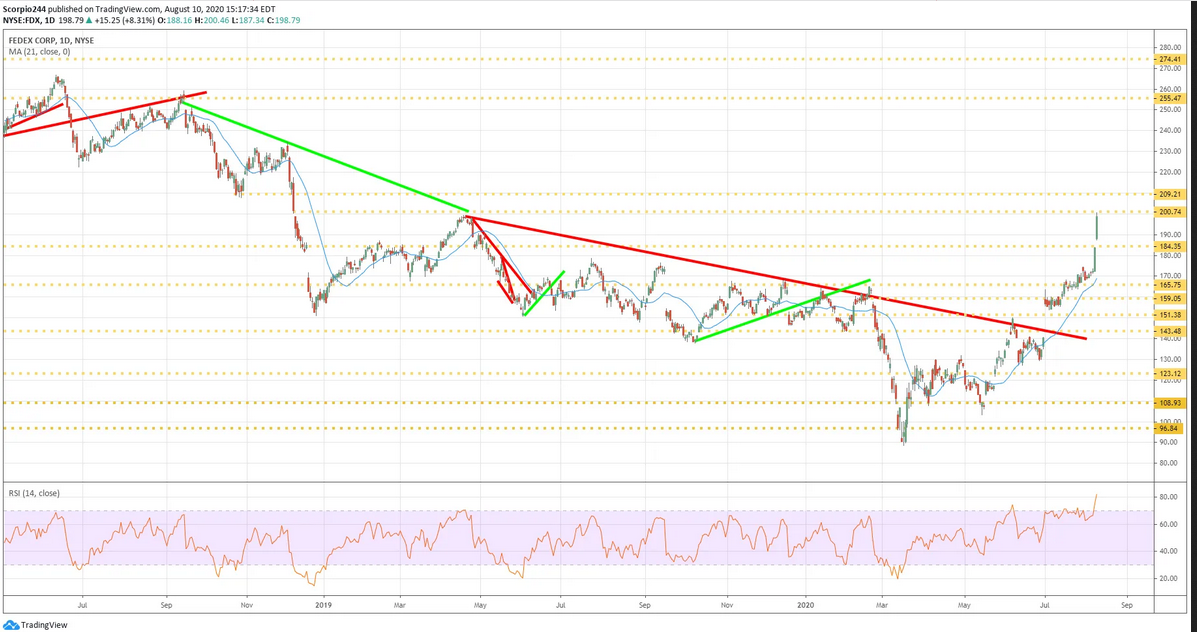
I don’t know how much further FDX can rise from here, there seems to be a lot of momentum behind it. After $201 the next price is $209. It is really overbought thought. I doubt it goes any further.
