Get 40% Off
🤯 Perficient is up a mind-blowing 53%. Our ProPicks AI saw the buying opportunity in March.Read full update

Stocks Dip Then Rip On Another Manic Monday

Published 12/22/2020, 12:13 AM
Updated 09/20/2023, 06:34 AM

Stocks fell sharply to start the day on December 21 but managed to stage a fairly sizeable rally. The volatility in the market is not all that surprising, given it followed quadruple witching. The storming back of the market wasn’t surprising either, given it has been the mantra of the market since March. But really, the rally may have been more about the mechanics and the algo’s working overtime to fill the technical gap that was created by yesterday’s steep sell-off at the open.

S&P 500

Overall, the S&P 500 fell by roughly 40bps and was down nearly 2% at one point. It found firm support at 3,637, and just rallied back, and nearly filled the gap, but didn’t have enough in the tank to finish it off.

An increase to 3,710 would not be surprising, which would complete the gap fill. But whether that happens or not may not matter. I would tend to think that there is further to fall in this leg. Again, there are plenty of open gaps below, with the next at 3,620 and then 3,580.

The COVID variant news in the UK was not “new” news; it has been circulating since the middle of last week. We have been following it regularly. It makes for a great headline, of course, but that is about all.
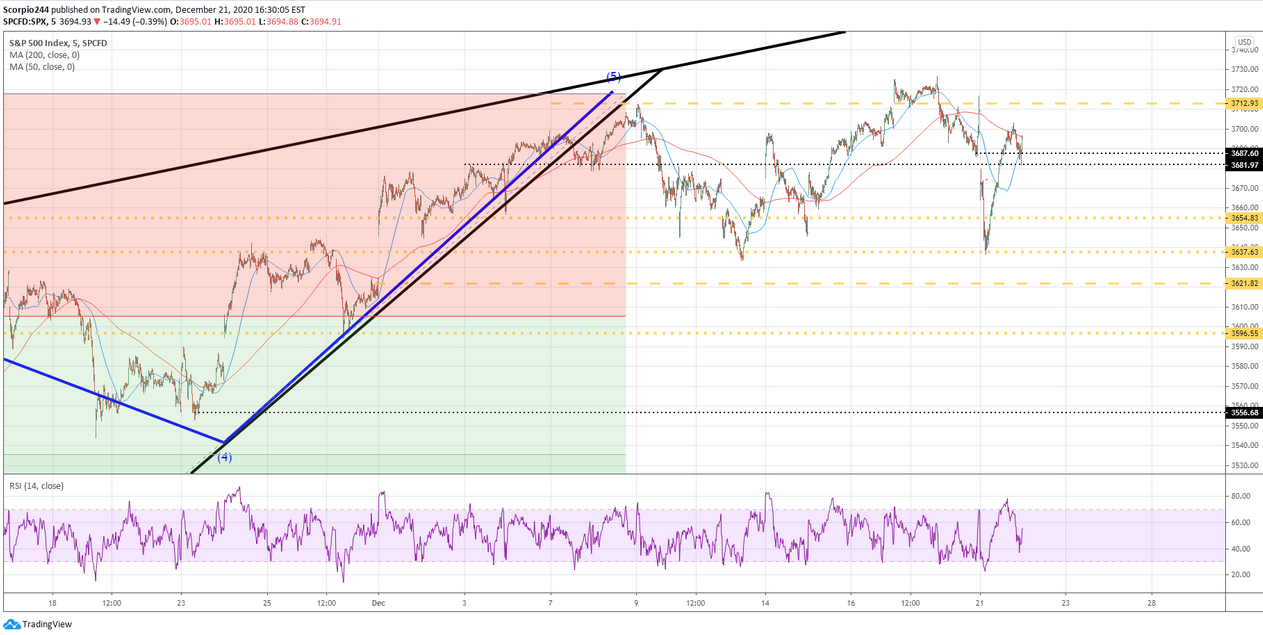
SPX Chart

VIX

The same thing happened yesterday in the VIX index.
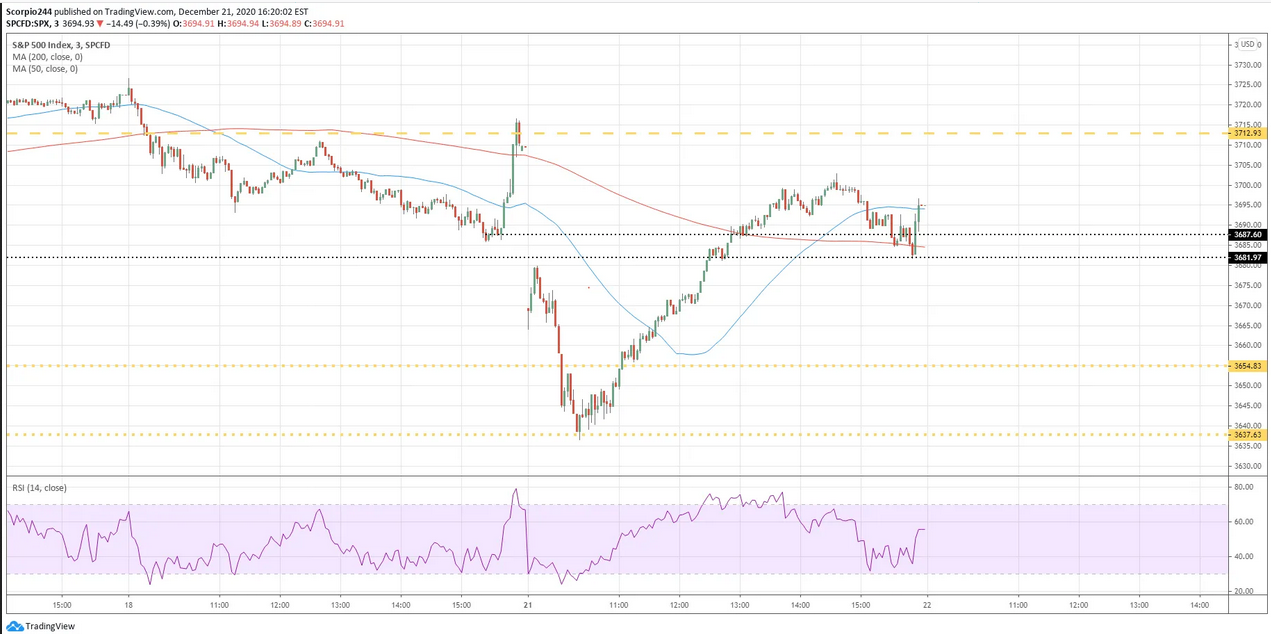
SPX Index Chart

Tesla

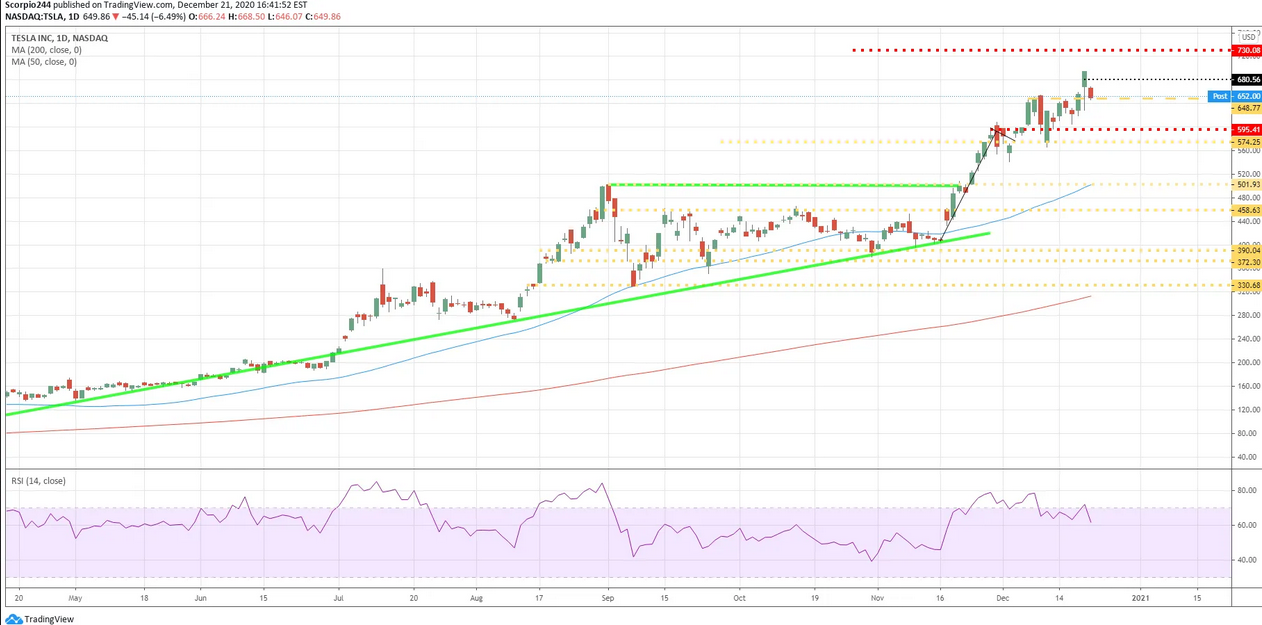
Tesla (NASDAQ:TSLA) did trade lower yesterday following its S&P 500 inclusion, falling by nearly 6%. The stock did manage to hold on to support at $650. The RSI is starting to diverge lower, and I am beginning to think the big run up may have peaked for now. We will see today if there is follow-through, but a break of $650 sends it lower to $575
3rd party Ad. Not an offer or recommendation by Investing.com. See disclosure here or remove ads .

Tesla Inc Daily Chart

AMD

AMD fell yesterday, and closed right on the uptrend, and is too close to call. But there was some bearish betting I picked up on at the $100 strike price, which makes me think this is one that will finally break and head towards $87.
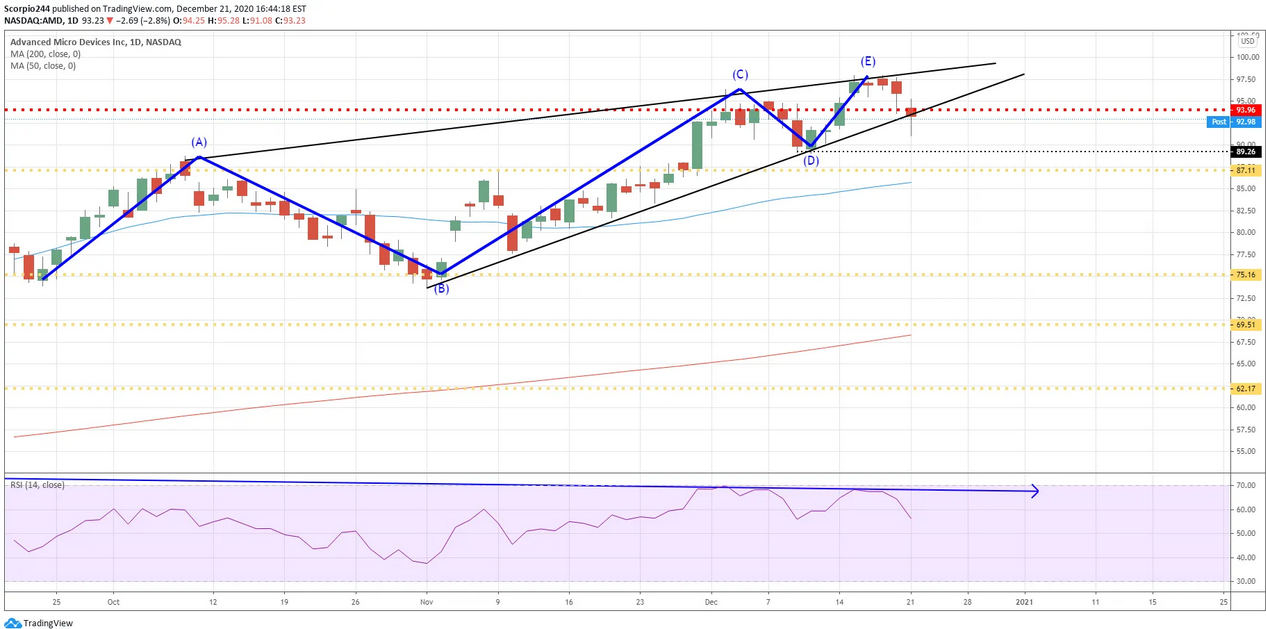
AMD Daily Chart

Zoom

Zoom may turn higher over the short-term here, before resuming it downward ways. The RSI is starting to move up; meanwhile, the stock is moving above resistance around $408. I think it has a window of opportunity short-term to fill the gap at $476.
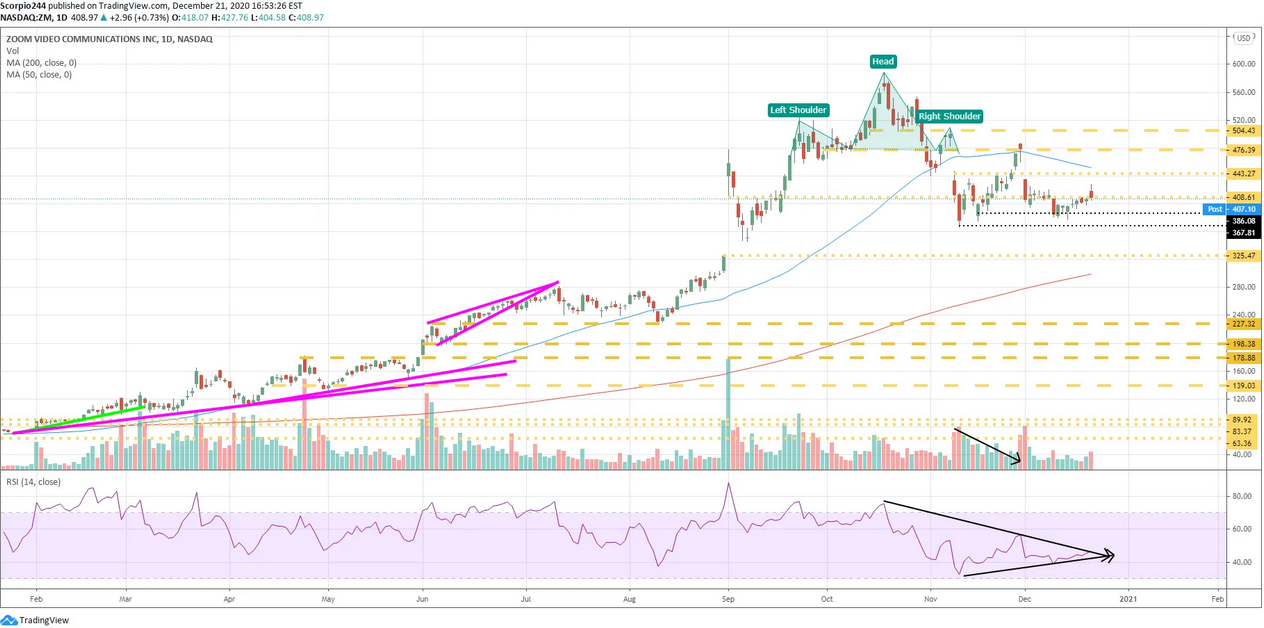
Zoom Inc Daily Chart

eBay

eBay (NASDAQ:EBAY) has been trending lower since July and filled a gap at $53.90. For now, I think it will continue lower towards its 200-day moving average at $48.
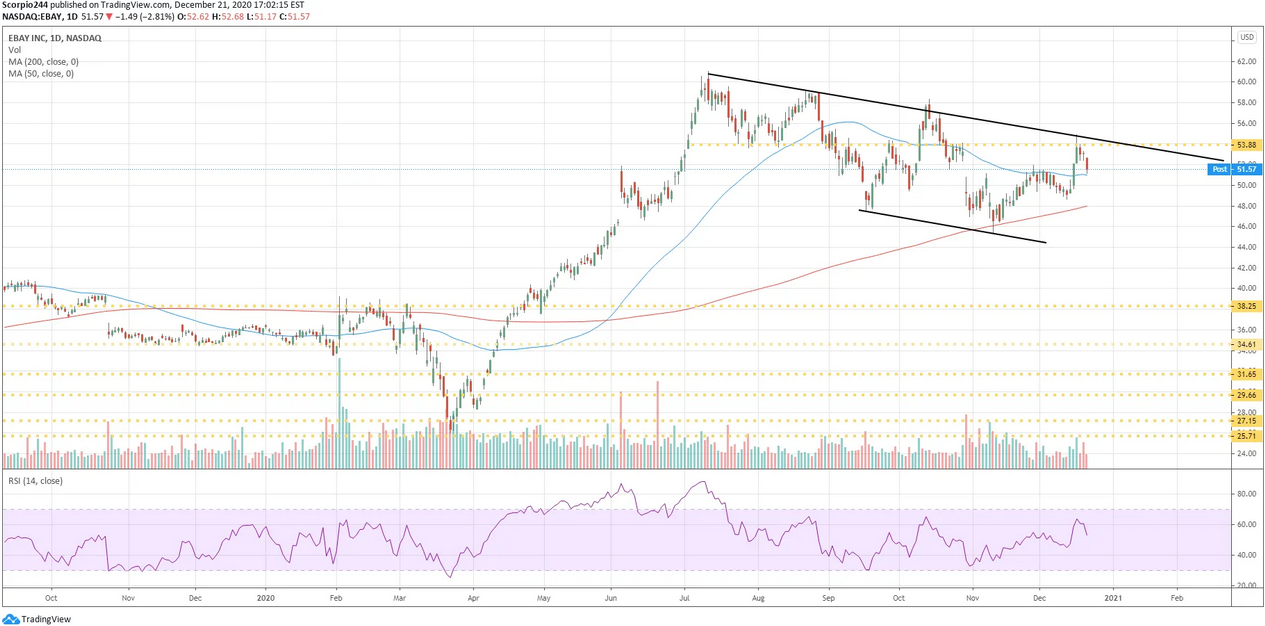
Ebay Inc Daily Chart

Original Post

Latest comments

Risk Disclosure: Trading in financial instruments and/or cryptocurrencies involves high risks including the risk of losing some, or all, of your investment amount, and may not be suitable for all investors. Prices of cryptocurrencies are extremely volatile and may be affected by external factors such as financial, regulatory or political events. Trading on margin increases the financial risks.
Before deciding to trade in financial instrument or cryptocurrencies you should be fully informed of the risks and costs associated with trading the financial markets, carefully consider your investment objectives, level of experience, and risk appetite, and seek professional advice where needed.
Fusion Media would like to remind you that the data contained in this website is not necessarily real-time nor accurate. The data and prices on the website are not necessarily provided by any market or exchange, but may be provided by market makers, and so prices may not be accurate and may differ from the actual price at any given market, meaning prices are indicative and not appropriate for trading purposes. Fusion Media and any provider of the data contained in this website will not accept liability for any loss or damage as a result of your trading, or your reliance on the information contained within this website.
It is prohibited to use, store, reproduce, display, modify, transmit or distribute the data contained in this website without the explicit prior written permission of Fusion Media and/or the data provider. All intellectual property rights are reserved by the providers and/or the exchange providing the data contained in this website.
Fusion Media may be compensated by the advertisers that appear on the website, based on your interaction with the advertisements or advertisers.
© 2007-2024 - Fusion Media Limited. All Rights Reserved.