Stocks had another strong day. I wasn’t that thrilled with the rally. Maybe it is because the market is going up too fast, perhaps it is because the Russell trades like garbage. I don’t know. But for someone that has been as bullish as I have been throughout all of 2019, I should be more than thrilled. I’m not.
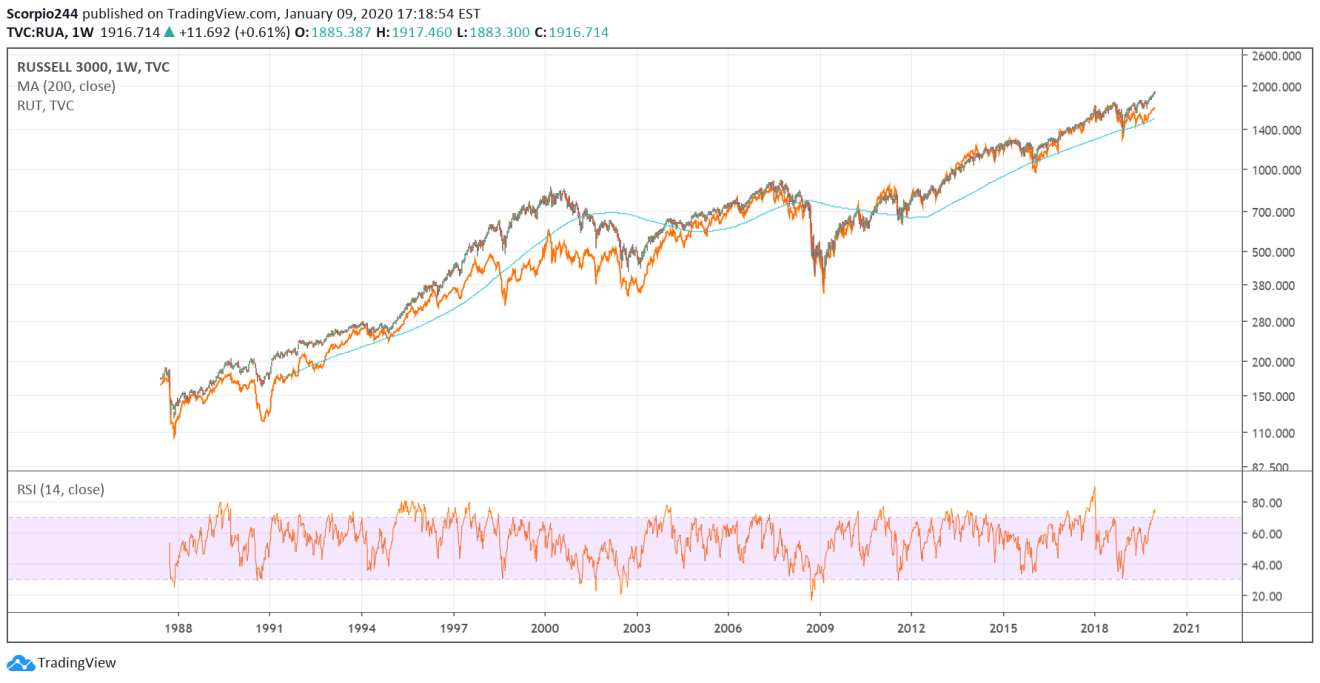
The rally in the equity market is entirely lead by large-cap stocks. We can see that by how the Russell 3000 and the Russell 2000 trade.
The chart below shows the two indexes and their close correlation over time. Well, except for one period of time, from 1996 until 2002. It could suggest two things, the Russell has some catching up to do, or we are at the very beginnings of a euphoric phase in the equity market, that will see just the biggest companies lead the charge higher.
By the way, I ran a log chart so you can better see the separation periods.
Here it is from another viewpoint as a ratio, the Russell 3000/Russell 2000. You can get the picture.
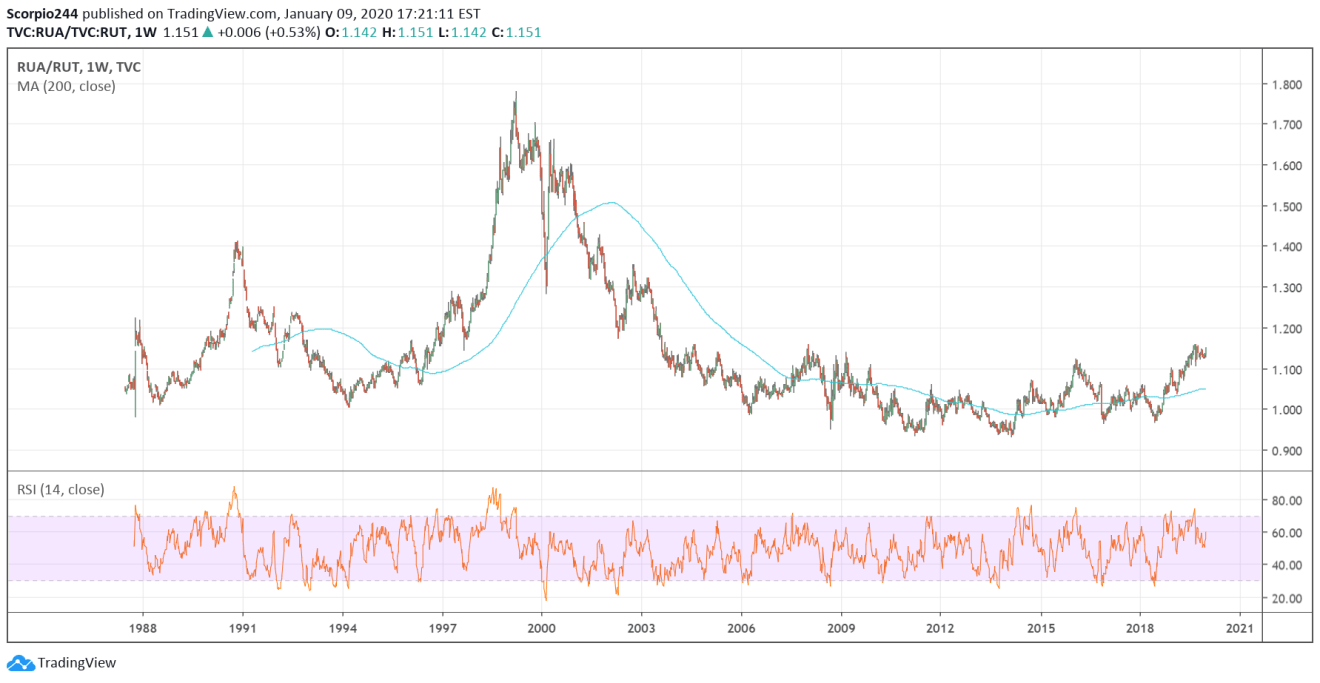
Not to mince any words, I am by no way trying to say the market is topping out. I’m not; in fact, I think it still has much further to run, as I noted in a video segment today. What I am trying to say is that the health of the rally is not what I want. It is very well possible for a rally like this to go on for years. Still, it suggests that a period of overvaluation and exuberance lies ahead, and that is likely not to end well when it does finally happen.
Lets us hope that the market repairs itself, and we see a rally that the entire market is participating in, not just a handful.
Apple
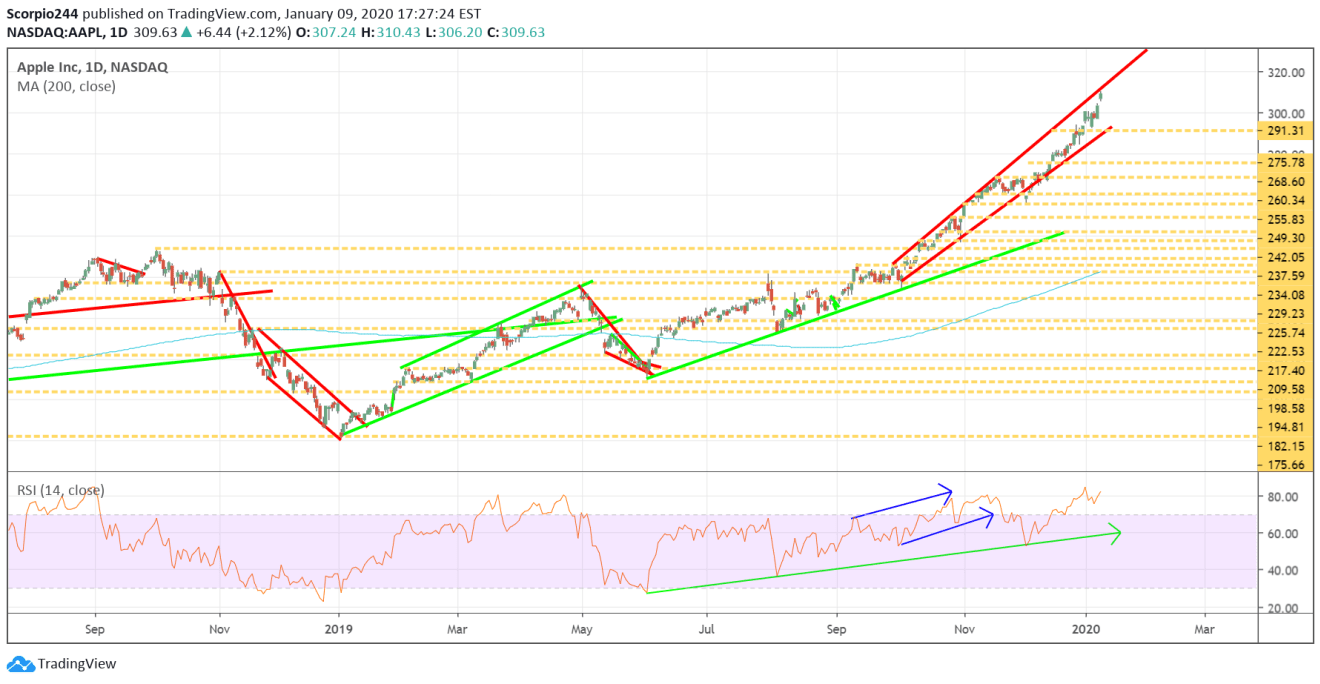
Apple's (NASDAQ:AAPL) rally has been breathtaking, and in all of my years, I can’t remember many instances like what we have witnessed here. The stock’s RSI is over 80. It is bumping up against resistance, and perhaps that means it is finally time for a breather? Perhaps. I honestly do not know.
Beyond Meat
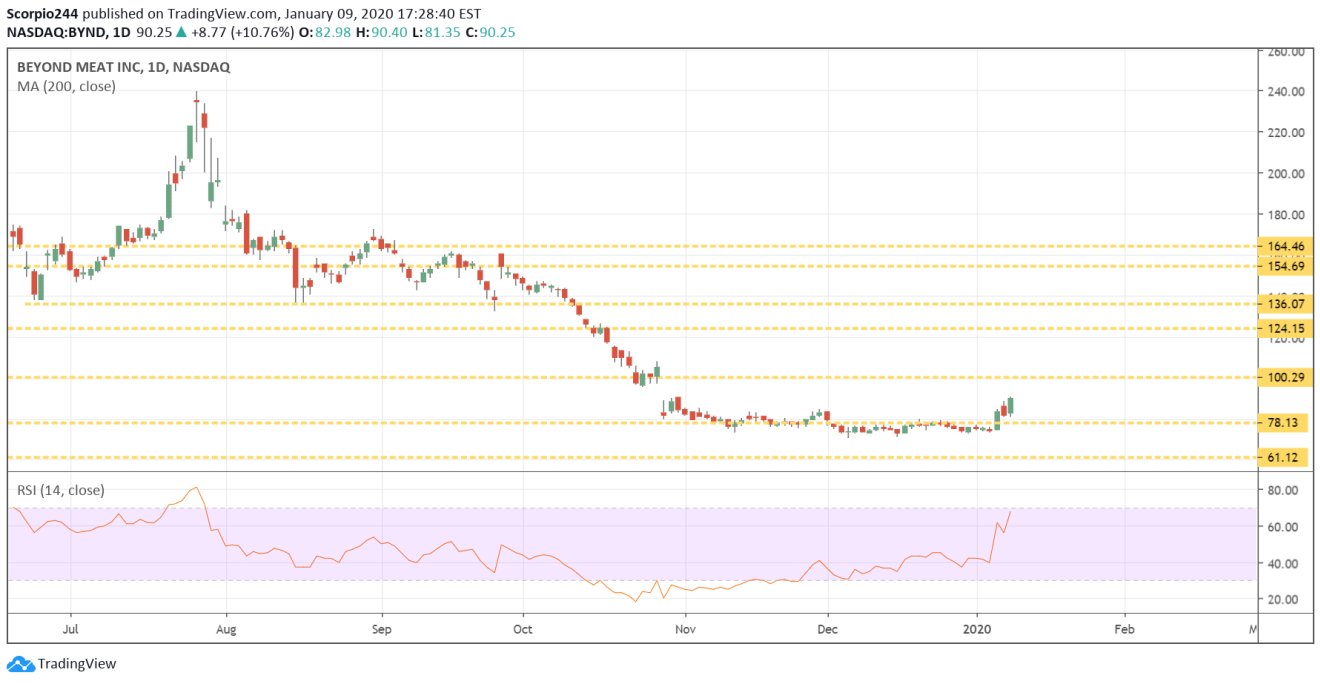
Beyond Meat (NASDAQ:BYND) is moving higher and is starting to get some real momentum, and I think now the stock can finally make that run back to $100. I talked about in the midday commentary, with my creative title =) – STOCKS BREAK OUT
Roku (ROKU)
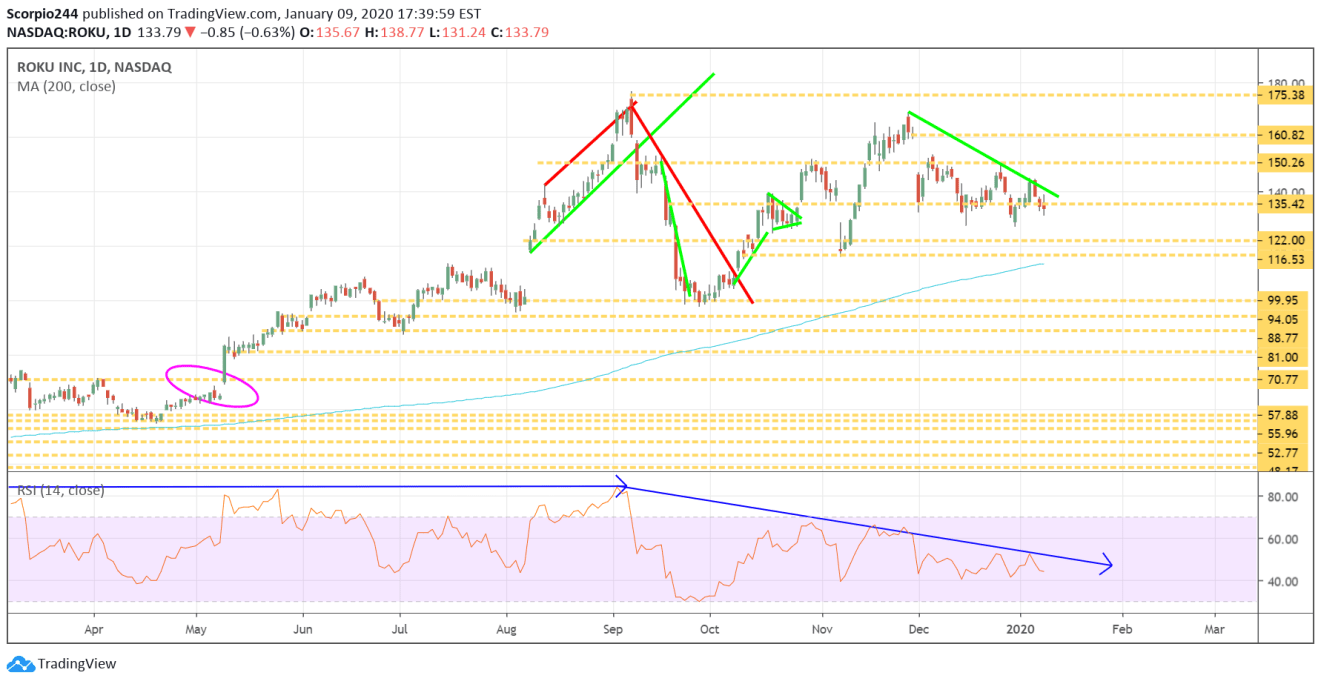
I gazed into Roku's (NASDAQ:ROKU) chart for some time, kind of like how Nostramdus looked into his mirror to see the future. I was mesmerized by that perfectly trending RSI pattern lower, when it dawned on me that perhaps Roku is forming a descending triangle, and that would mean the stock goes lower towards $122. A fortuneteller, I am not, though.
Acadia (ACAD)
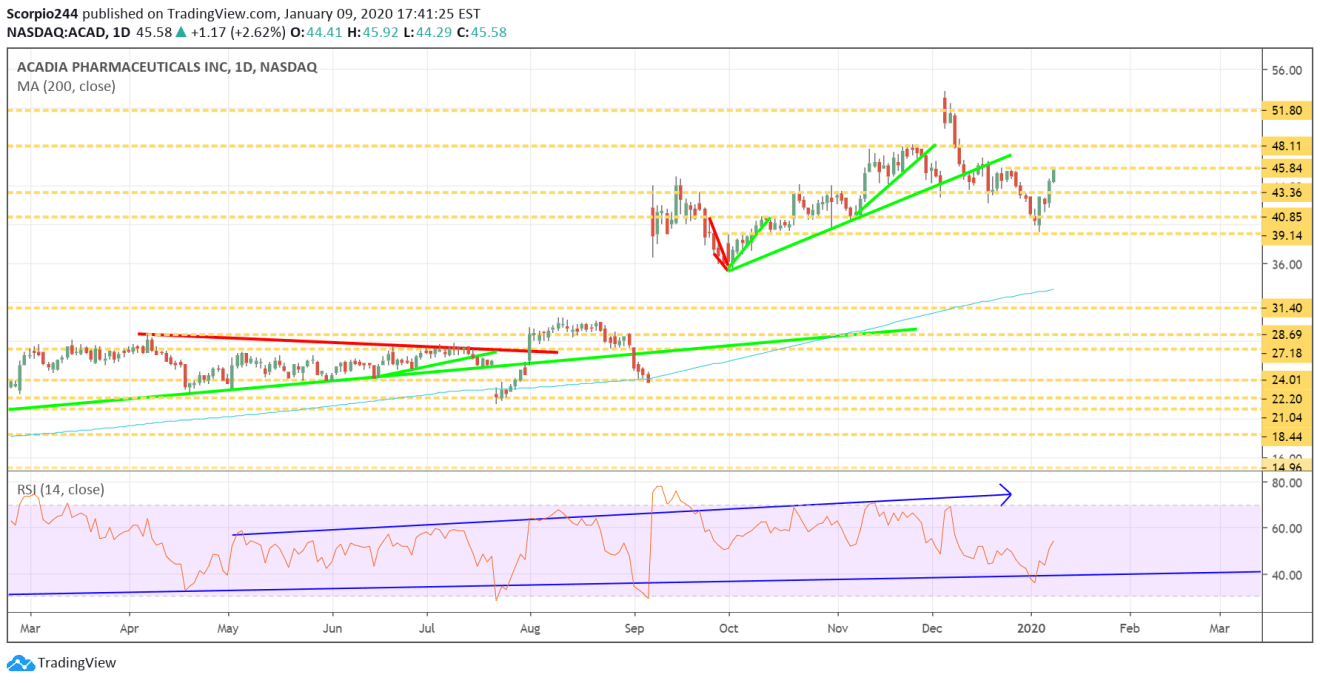
ACADIA Pharma (NASDAQ:ACAD) has finally caught a bounce, and perhaps it can even get over resistance $45.85, and a go back to $48. I sure hope so.
JD.com (JD)
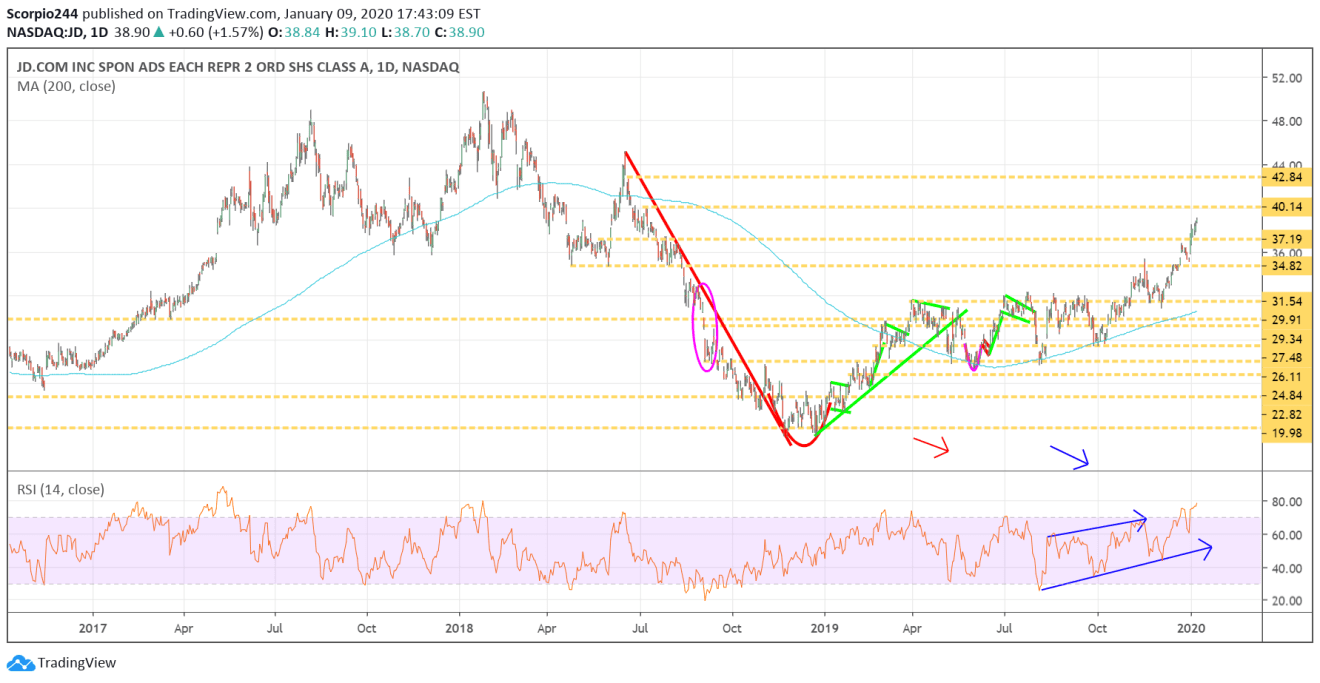
I wrote a free article for JD.com (NASDAQ:JD), noting that bullish option betting was indicating the stock may be heading towards $42. The chart would seem to agree. JD.Com’s Hot Run May Not Even Be Close To Being Over
