Issac Newton is famous for having said, “What goes up must come down.” He is equally well-remembered for a falling apple striking his noggin, supposedly inspiring the physicist to develop the theory of gravity.
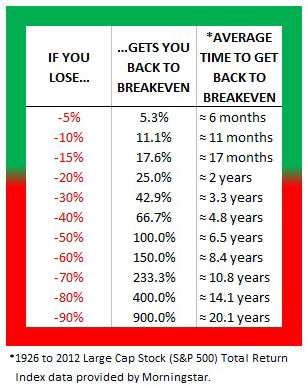
Near market tops, bullish investors embrace the notion of an opposite force: levity. They maintain that what goes down must come back up, implying that one should ignore price depreciation since assets always recover. The problem? The belief in stock-market levity does not account for the time it may take for one to recover his/her principal.
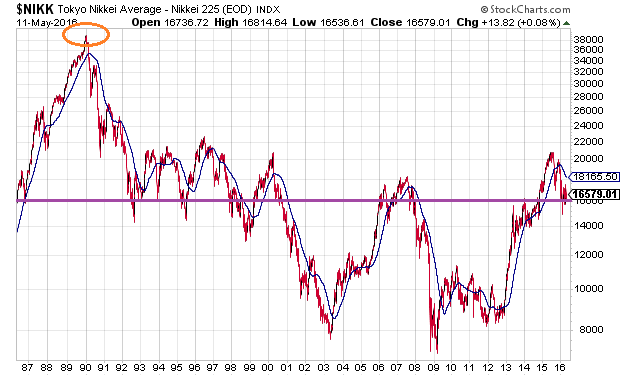
Consider the world’s third largest economy. The Nikkei is in the same spot that it sat 30 years earlier. That is a significant loss of purchasing power on an inflation-adjusted basis. Equally worthy of note, Japanese equities are still down more than 50% from 1990.
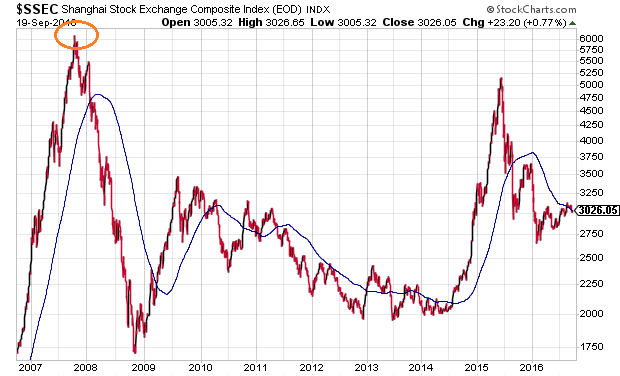
What about the world’s 2nd largest economy, China? The emerging market has far more equity growth to crow about over the last three decades. On the flip side, China’s Shanghai Composite is still down more than 50% after 9 years. Worse yet, with debt at 255% of GDP, the Bank for International Settlements believes there is an enormous risk of a Chinese banking crisis within the next three years.
It follows that Chinese equities are unlikely to levitate back to 2007’s flat-line anytime soon. In fact, the debt-fueled support for China’s economy may set the stage for additional losses from current levels.
Ethnocentric American investors often dismiss the world’s second and third largest economies; they typically dismiss European equity woes as well. Indeed, the belief system on levitating U.S. stocks is so strong, many of us fail to grasp that the U.S. NASDAQ Composite has an inflation-adjusted 17-year return of approximately -30%. (And that’s with stock indices – S&P 500, NASDAQ, Dow Industrials – residing near record peaks.)
Bear in mind, the most reliable measures of stock valuation indicate that U.S. stocks across the board are considerably overvalued. For instance, the median trailing price-to-earnings ratio (P/E) with reported earnings and current price is 23. That places the S&P 500 26% above the 50-year fair value level (median stock average P/E 17).
What about forward earnings? According to Cliff Asness, co-founder of AQR Capital Management, forward estimates since 1871 place median forward P/Es at 11. Where does that place a stock market with forward 12-month estimates of 16.5? It suggest an equity market that is overvalued by 50%.
Perhaps an earnings-based valuation methodology is not your cup of coffee. One might choose to focus on corporate equities as a percentage of GDP. Here one discovers that U.S. stocks are currently 35% above an exponential regression line (mean).
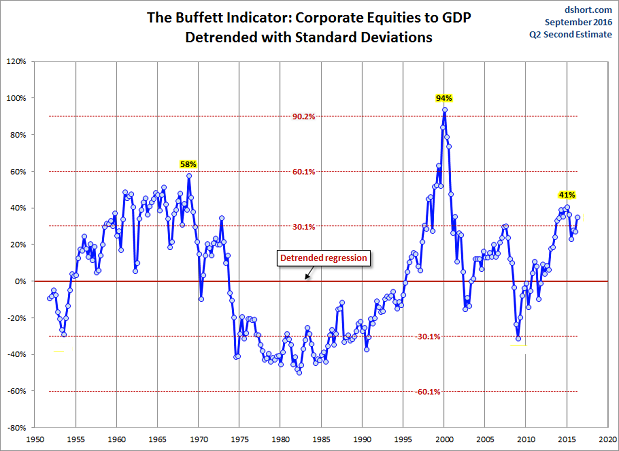
Simply stated, stocks may be overvalued by 26%-50% on traditional measures. And the percentages? They are percentages above fair value, not percentages above bargain levels that typically come to fruition during stock market bears.
Granted, levity is a high probability force in the investing world. You can choose to hope that you will recover your principal from the next downturn and eventually prosper. However, the folks at GMO paint a dismal 7-year picture for holding U.S. stocks.
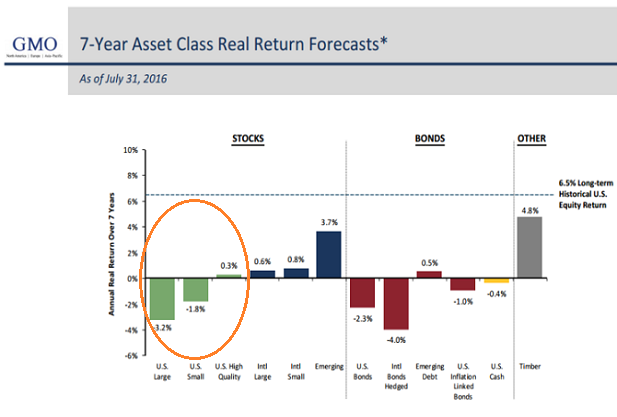
Might raising some cash be sensible for adding U.S. stock assets at lower prices?
It is critical to understand that what goes up will come down… more critical than keeping the faith that what goes down must come up. In particular, money cannot truly benefit from compounding without limitations on the real risk of financial loss. One must lose less when gravity becomes the “force majeure” if one intends to benefit from levitating asset prices.
