Upcoming US Events for Today:
- Durable Goods Orders for October will be released at 8:30am. The market expects New Orders to decline month-over-month by 2.0% versus an increase of 3.7% previous. Excluding Transportation, order are expected to increase by 0.4% versus a decline of 0.1% previous.
- Weekly Jobless Claims will be released at 8:30am. The market expects Initial Claims to show 330K versus 323K previous.
- Chicago Fed National Activity Index for October will be released at 8:30am. The market expects 0.20 versus 0.14 previous.
- Chicago PMI for November will be released at 9:45am. The market expects 60.5 versus 65.9 previous.
- Consumer Sentiment for November will be released at 9:55am. The market expects 73.3 versus 72.0 previous.
- Leading Indicators for October will be released at 10:00am. The market expects a month-over-month increase of 0.1% versus an increase of 0.7% previous.
- Weekly Crude Inventories will be released at 10:30.
- Agricultural Prices for November will be released at 3:00pm.
Upcoming International Events for Today:
- German Consumer Confidence for December will be released at 4:00am EST. The market expects 7.1 versus 7.0 previous.
- Great Britain GDP for the Third Quarter will be released at 4:30am EST. The market expects a year-over-year increase of 1.5%, consistent with the previous report.
- Japan Retail Sales for October will be released at 6:50pm EST. The market expects a year-over-year increase of 2.2% versus an increase of 3.1% previous.
The Markets
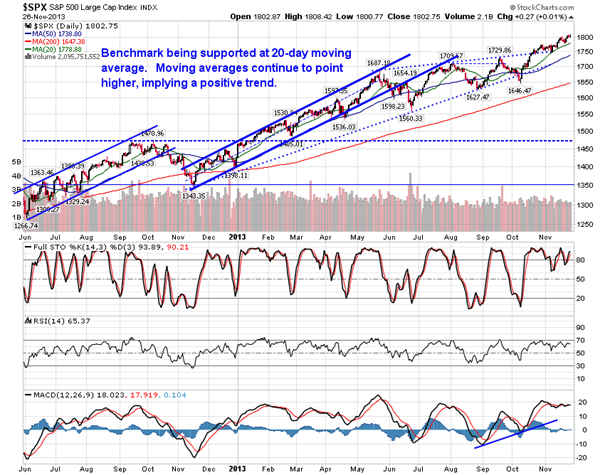
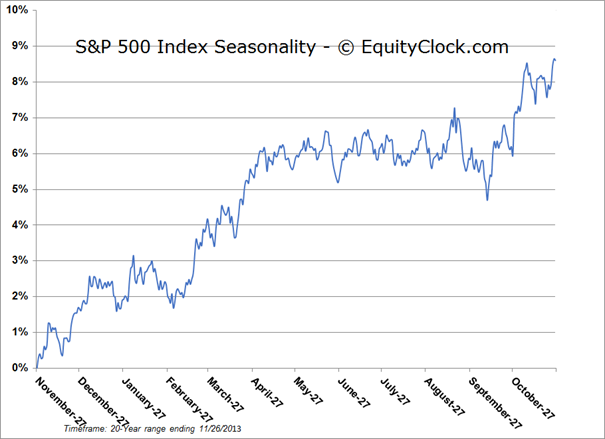
Stocks ended around the flatline on Tuesday after giving up gains in the last hour of trade. Reallocation of portfolios ahead of the month-end is suspected as culprit for the abrupt selloff into the close. Despite the broad decline to end the day, the NASDAQ still managed to close above 4000, a key psychological level that the benchmark had been struggling around for the last few weeks. The S&P 500 and the Dow Jones Industrial Average retained their breakout positions above 1800 and 16,000, respectively. Looking at the hourly chart of the S&P 500, the benchmark closed below its rising 20-hour moving average, the first close below this level since mid-month. An hourly MACD sell signal was completed during Tuesday’s session, suggesting a soft patch ahead. Support, when looking at this short-term view of the market, remains at 1775. Seasonal tendencies for equity markets into the end of the month, through the US Thanksgiving holiday, are generally positive, drifting higher in a low volume trade.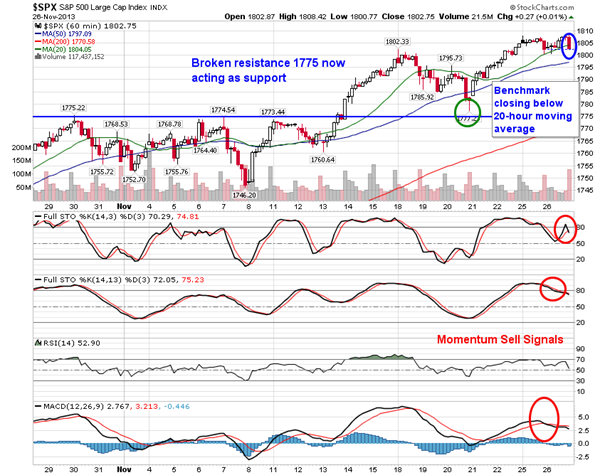
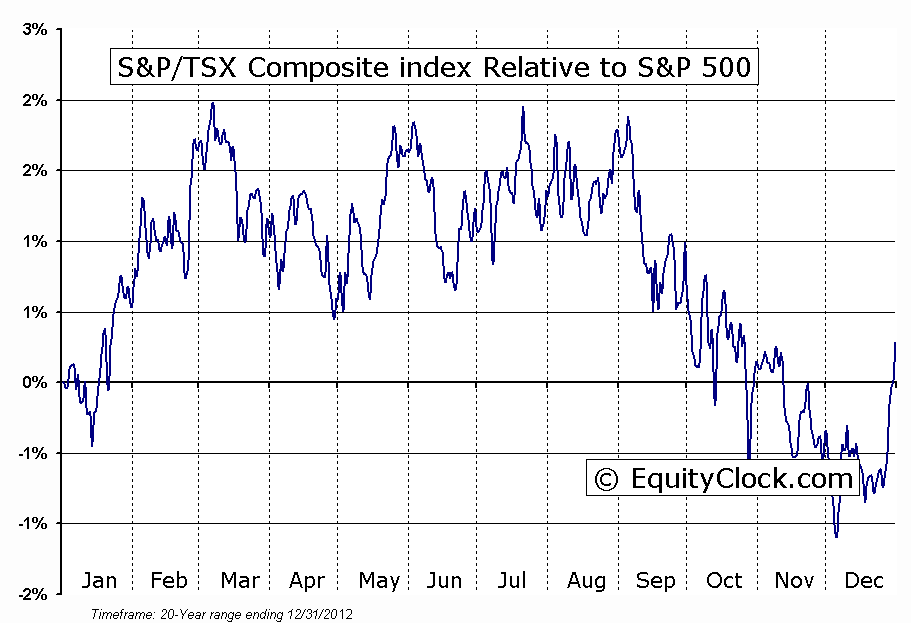
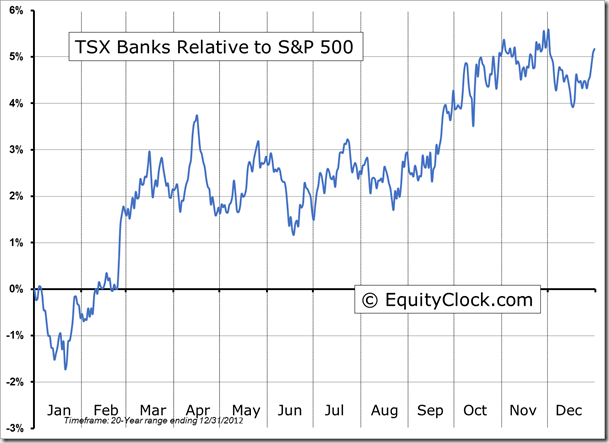
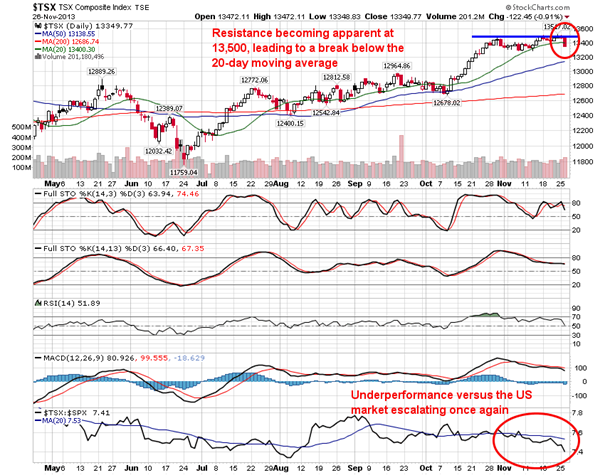
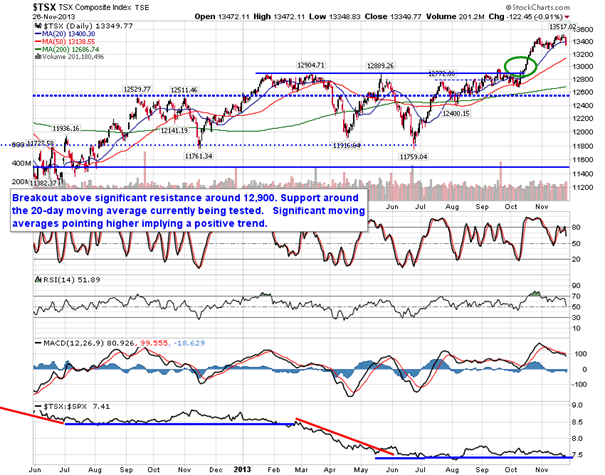
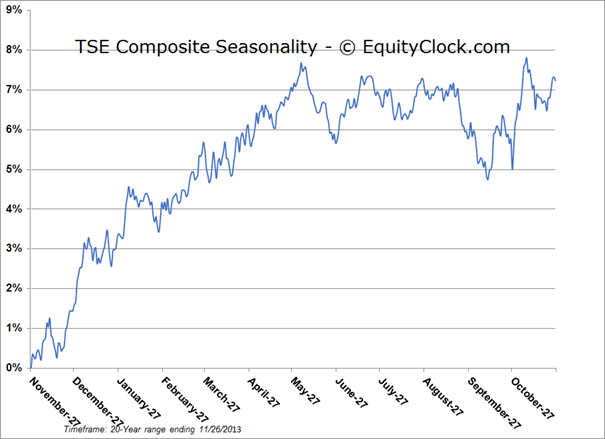
Meanwhile, the TSX Composite failed to achieve positive territory at all on Tuesday, declining by nearly 1% as financial and material stocks realized selling pressures. The S&P/TSX Capped Financial Services Index broke below a strong rising short-term trendline that carried the sector higher since mid-October. Earnings for the major Canadian banks are due to be released in the coming days and profit-taking ahead of the event is the suspected reason behind the pronounced one-day loss. Positive seasonal tendencies for the sector conclude at this time of year, leading to underperformance versus the equity market until mid to late January when the next seasonal up-leg begins. As a result of weakness in a number of sectors on Tuesday, the TSX composite closed below the 20-day moving average for the first time since the start of October. Resistance for the Canadian benchmark is becoming apparent around 13,500; underperformance versus the US market is escalating once again. Relative performance of the Canadian benchmark seasonally spikes into the last half of December, outperforming the US benchmark, on average, through to the beginning of March.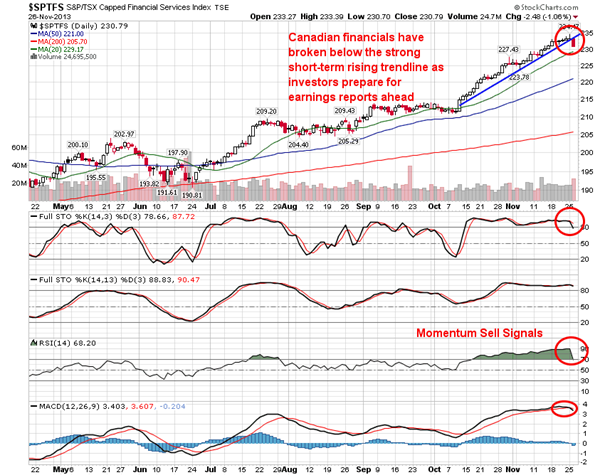
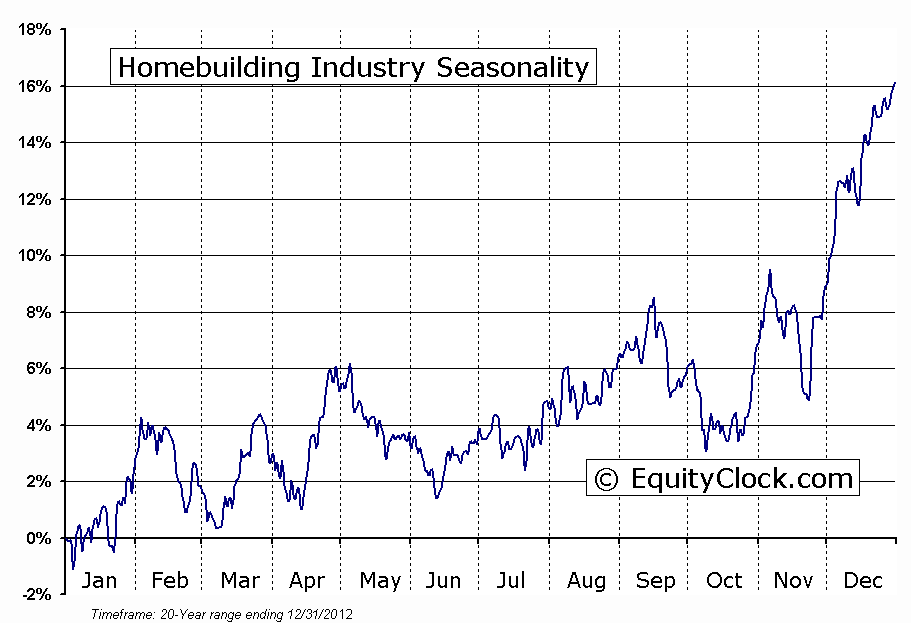
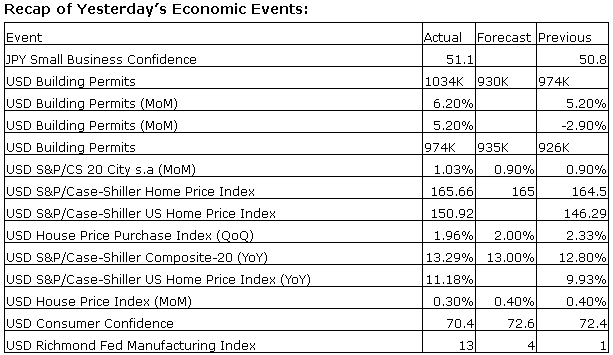
One of the strongest segments of the market on Tuesday was the home builders following a better than expected report on building permits for the month of October. As a result, the iShares Dow Jones US Home Construction ETF jumped 3.32%, breaking above its 200-day moving average for the third time since mid-September. The ETF stopped at a point of resistance presented by a short-term declining trendline, currently at $23.33. Outperformance versus the market is starting to become apparent. The industry is entering the peak period of seasonal strength, running between now and the start of February. The month of December is by far the strongest month of the year for the subsector, gaining 7.4%, on average, over the past 20 years. Positive results were achieved in 17 of the past 20 December’s.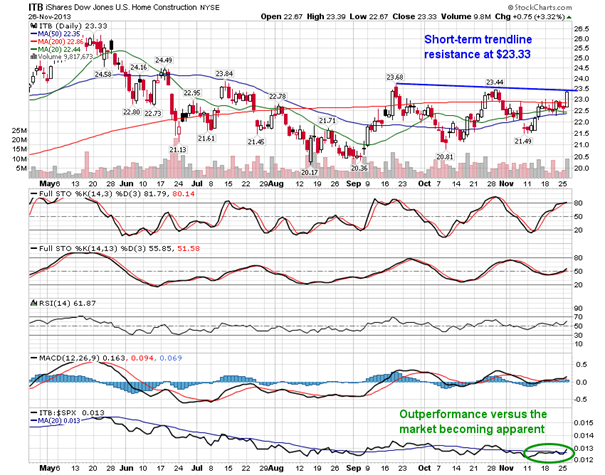
Seasonal charts of companies reporting earnings today:
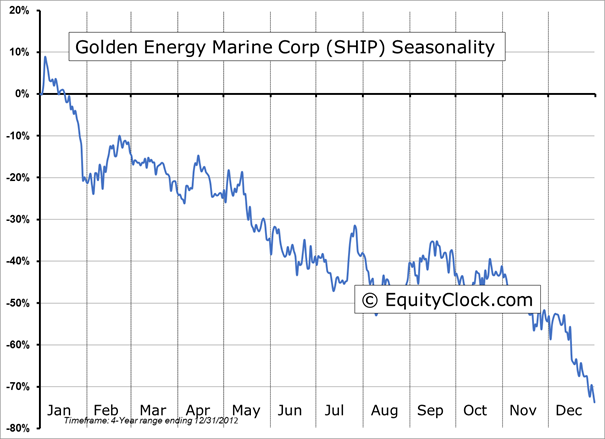
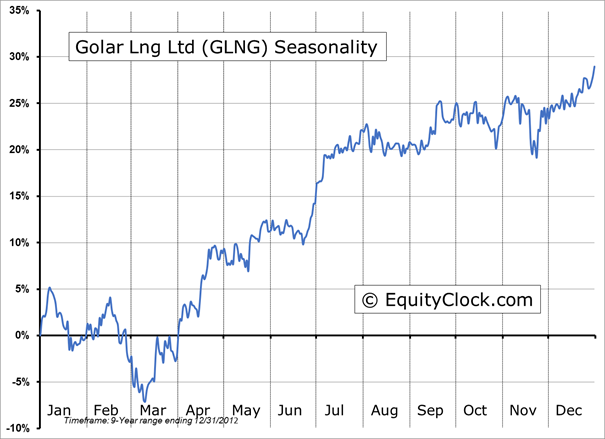
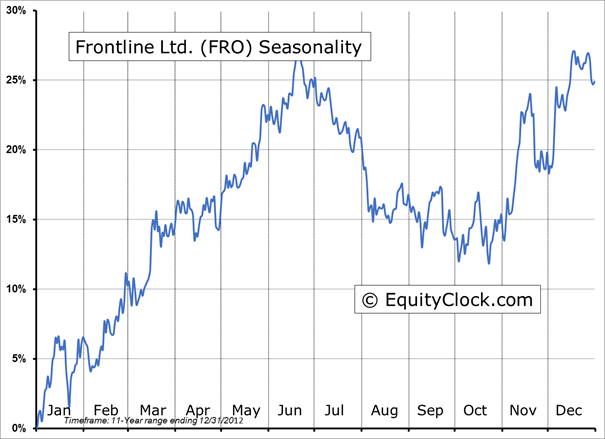
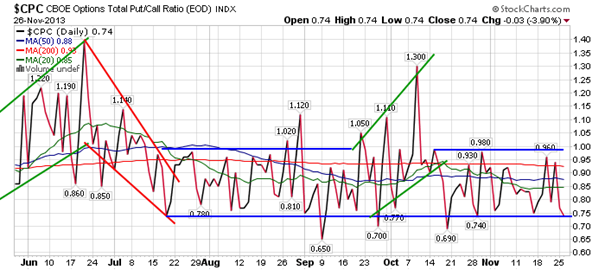
Sentiment on Tuesday, as gauged by the put-call ratio, ended bullish at 0.74. The ratio is back to around the lows of the year, suggesting heightened complacency.
S&P 500 Index
TSE Composite
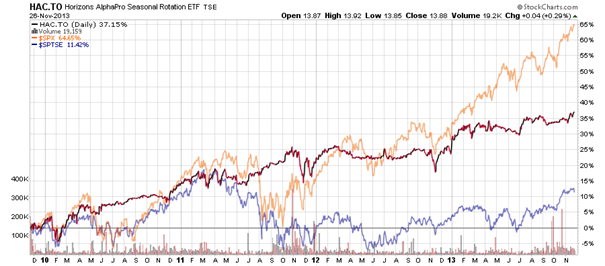
Horizons Seasonal Rotation ETF (TSX:HAC)
- Closing Market Value: $13.88 (up 0.29%)
- Closing NAV/Unit: $13.88 (up 0.17%)
Performance*
Performance calculated on Closing NAV/Unit as provided by custodian 