Calling for a significant stock market decline in 2014 is a fairly simple call for me. For the bulls on the other hand, they are looking for more gains based on hopium and delusional forecasts. The Feds facilitated move is about to end in a significant way.
Pundits and Analysts Bullish Case for Higher Stock Prices:
- GDP Forecasts - Economists are projecting 3% GDP for 2014. Even if attained which there are no assurances of, it still is not enough to support the S&P 500 at current price levels of 1838.70 (January 17, 2014, Friday’s closing price) let alone higher prices; we are in a slow growth era.
- Price to Earnings Multiple Expansion - Analysts are projecting $121 for the S&P 500 earnings in 2014.Based on these estimates, we have a PE of 15.20 based on the current S&P 500 price which is far too high for the slow growth era we currently are in. There are no assurances these earnings will be met and there is lack of real revenue growth to support a multiple expansion as most of the earnings improvement have been due to productivity enhancements. Analyst earnings estimates actually exceed what the companies themselves are calling for. Based on other slow growth eras from the past, one can typically expect to see a PE anywhere from 8-12 which would put the S&P somewhere between 968-1452.
- Fund Managers Talking Their Book: They have no choice but to look for higher prices because they are loaded with stocks and have no way of fully protecting or hedging themselves.
- Wall of Worry/Investor Skepticism: So many investors are skeptical or worried about the stock market dropping that bulls point to this as a reason for it to rally further.
- S&P Returns of 25%-30%: Analysts will point to historical data that says after such large returns, the following year is met by another good year. That may be very true but at this juncture; you have an overextended market, over leveraged market, one that has not seen any real correction in a year and one that has gone up about 175% from the March 2009 lows. This will be a year where that rationale does not work.
- Rising Dividends: This may be true but not enough to solely move stocks higher.
- Quantitative Easing: Oops, that is right; tapering is about to begin and the addictive drug to this market about to be removed. This use to be the argument we heard before but that game has ended.
From many reads and listening very carefully to the so-called pros (pundits & analysts), I honestly can say this is what their bullish case revolves around.
My Bearish Case for Lower Stock Prices:
- Quantitative Easing: A change in monetary policy is about to begin with the tapering/winding down of QE. Historical data suggests stocks decline when this occurs. The bulls will tout monetary policy is still easy but it will not matter; the stock market will view it differently.
- China’s Housing/Skyscraper Bubble: It appears like a bubble has developed in housing and the threat of defaults is a real possibility. If this bursts, it will have negative global ramifications.
- Total Market Cap/GDP Indicator: This is Warren Buffet’s favorite measure of market value; as of January 17, 2014 the TMC/GDP stood at 116.2% which puts it in a significantly overvalued status. The lowest ever reading was 35% in the 1982 recession while the highest reading was 148% during the tech bubble in 2000. While this number changes daily, the bottom line is we are significantly overvalued based on this valuation metric. The last 2 times it was over 100% was back in 1999 & 2007 at market tops; we are at extreme valuations contrary to what many say or think.
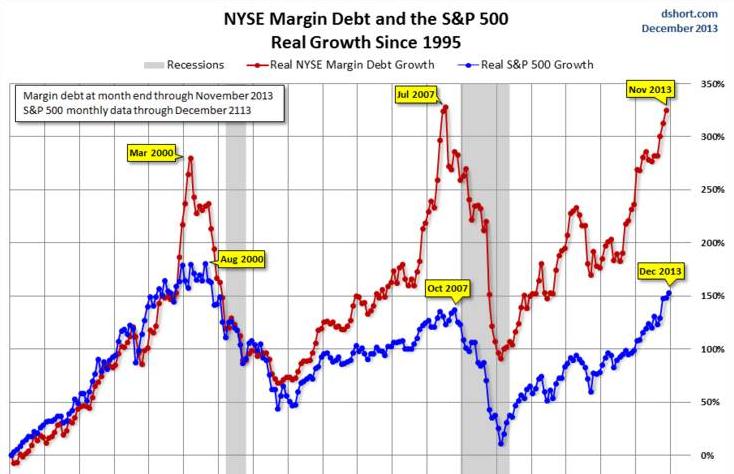
- Record NYSE Margin Levels: Far too much leverage has been used and facilitated by the easy monetary policy for the type of earnings and economic growth we have. This will all have to be unwound which could exacerbate the downside.

- Price to Earnings Multiple: Based on trailing GAAP earnings — looking at real accounting earnings — they are only $95. So, for those who say the S&P 500 is only trading at 15.20 times next year's estimates, you have to make some pretty aggressive assumptions on earnings growth to get to $121 from $95. Based on this $95 number, the S&P 500 is trading at about 19 times earnings. While I dislike using PE’s for analytical timing mechanisms, they are very valuable for the big picture.
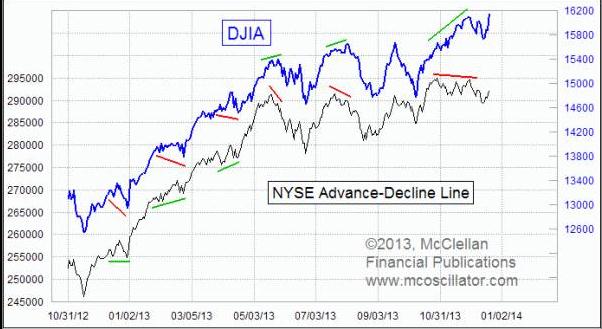
- Advance/Decline Ratio: As the market continues moving higher there is less and less participation. This is generally not a good sign especially with a market so extended and one that has not seen any real meaningful correction in the last year.

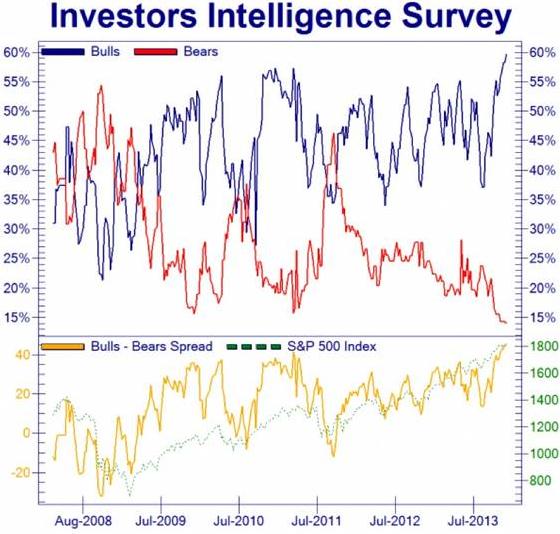
- Bull vs. Bear Sentiment Data: Despite the skepticism about this market, we have the largest spread ever of bulls vs. bears. Most bears have capitulated which is another classic sign of a top.
-

I could have continued with more reasons to support my bearish case for stocks but this will suffice. I believe the bull case for higher stocks is based on delusions and without merit, while the bear case is very logical but will take time to evolve.
Topping Process
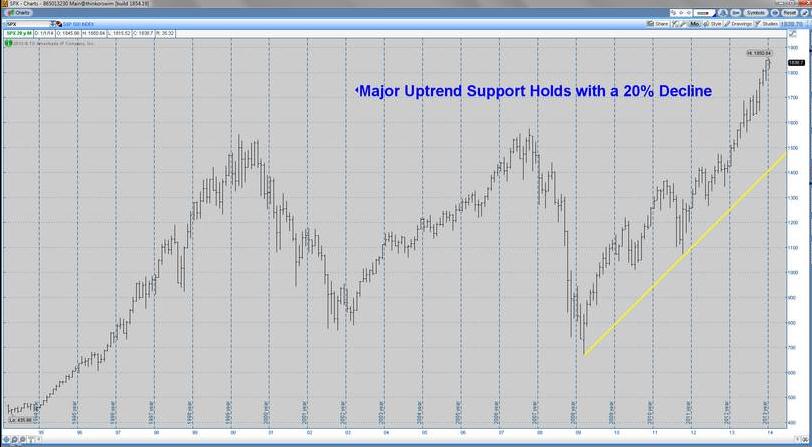
I think it is important to understand this is going to be a process that will take time to complete the topping pattern. In addition, it is important to realize there will not be a traffic light signal that tells you when the process is complete. For now, the boys and girls of Wall Street are doing their best to employ leverage and keep this market alive; holding key support levels. This is something we saw all of last year every time a correction was attempted but this game is about to END, and very soon. I think it is also important to point out that in terms of hedging and one-sided speculation in both funds and options; one can very clearly see that very few are short this market and nobody really owns any true protective puts or hedges. For now, we are in the transition phase of a market that has gone far too high, for far too long of a period of time and will begin a down phase. You could see this market decline 20% (S&P 500 1470) and the MAJOR UPTREND would still not be broken off the March 2009 lows.

The monthly S&P 500 chart above looks parabolic; these types of moves never end well. Just remember everything typically takes time and this is going to be a process; patience must be used.
Conclusion:
I think so many analysts are very confused and find it tough to maintain a coherent perspective on this stock market because soaring stock prices in theory should equate to a real economic recovery. We do not have a real economic recovery nor do we have a blistering economic recovery as the stock market move would suggest. The S&P multiple is simply not justified based on earnings or economic growth. I find it of interest that 2014 earnings estimates for the S&P 500 went from $106 in late December to a revised number of $121; a 14% increase. If historical data is any indication, that move by analysts will prove to be incorrect as they almost always fall short of their forecasts. Why the revision higher though, I ask? To rationalize higher S&P levels? Even if we had real earnings growth from revenue growth, along with meaningful economic growth; I would still be looking for a minimum of a 10% decline since we are so extended and have not had one for an extended period of time. The lack of any real pullback I believe signals the bulls are afraid that if they let this go, it could get out of control on the downside.
This is a stock market that has been held together by the Fed and has zero correlation with actual growth rates of today. The Fed stimulus is about to be slowly wound down and it will have a negative effect on stocks based on historical data. This means the S&P 500 will have to sober up to reflect the new normal growth which is going to be somewhere between 2%-4%. The proceeding decade was an abnormal anomaly. With that being said, the S&P 500 and all the averages will revert back to the mean that reflects the “actual”, not imaginary growth rates of the year or so ahead. I see no reason why in the fullness of time (decline could last into 2015), we do not see a 15%-20% decline from S&P 500 1851 peak (top has been seen in my estimation) or maybe more (30%-40%) depending upon world events. Although rare, if we had a singular event occur or if we break key support levels, we could even see a stock market crash as the ingredients exist.
The time has come to where we will get a reversion back to the mean with normalized valuations based on real earnings and real economic growth. This is by far, one of the largest disconnects we have seen between Wall Street and Main Street. Once the decline really begins in earnest, it would not surprise me if we did not see new All-Time-Highs for several years thereafter.
Disclosure: Since December of 2008, we have been teaching our members in our nightly video updates and daily live webcasts to be vigilant in this continued complex market environment. We teach our members how to protect their portfolios and actually capitalize and make money in both rising and declining markets. Take advantage of our 1 week “free” trial and learn how we make money on our day trades, swing trades and investments, on a long- term consistent basis.
