Get 40% Off
🤯 Perficient is up a mind-blowing 53%. Our ProPicks AI saw the buying opportunity in March.Read full update

Stock Market Cyclical Top Develops As Expected

Published 01/25/2016, 12:11 AM
Updated 07/09/2023, 06:31 AM

Last June, we observed developing weakness in the historic stock market bubble that suggested the bull market from 2009 had become susceptible to a long-term reversal. Following a long-term breakdown in August, the S&P 500 index rebounded violently and approached previous highs of the cyclical uptrend. However, after a period of mutual fund window dressing in December, prices declined violently for a second time, approaching previous lows of the breakdown in August.
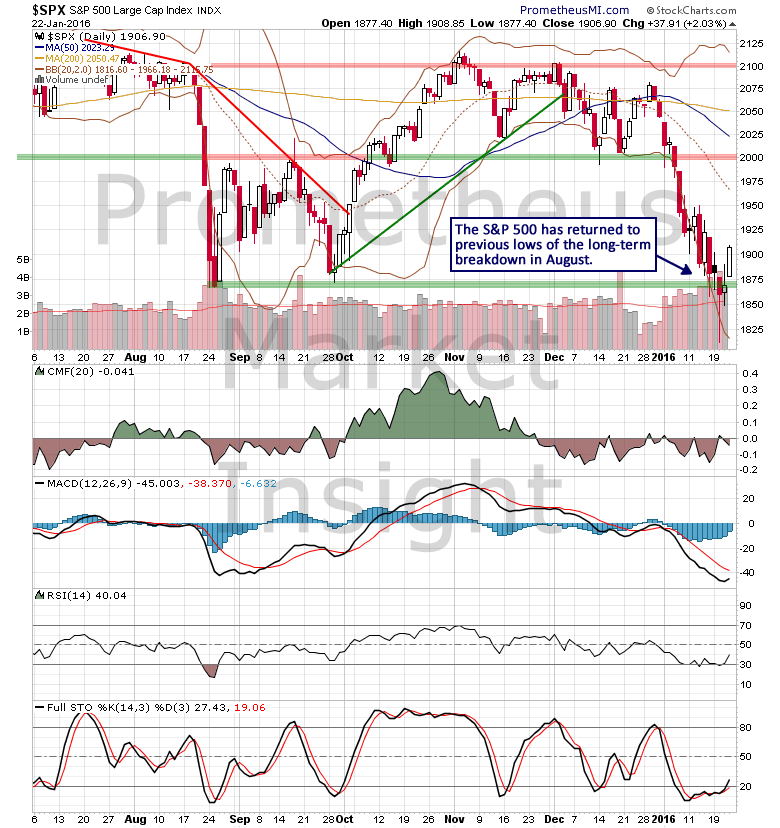
S&P 500 Daily Chart

From a long-term perspective, the stock market continues to exhibit typical behavior for the terminal phase of a highly speculative advance. Since the middle of 2014, the S&P 500 index has been forming a massive distribution pattern, indicating that the cyclical bull market from 2009 likely terminated in July of last year. Notice that technical indicators such as money flow, momentum and price oscillators have been steadily weakening as the formation has developed, further supporting the cyclical topping scenario.
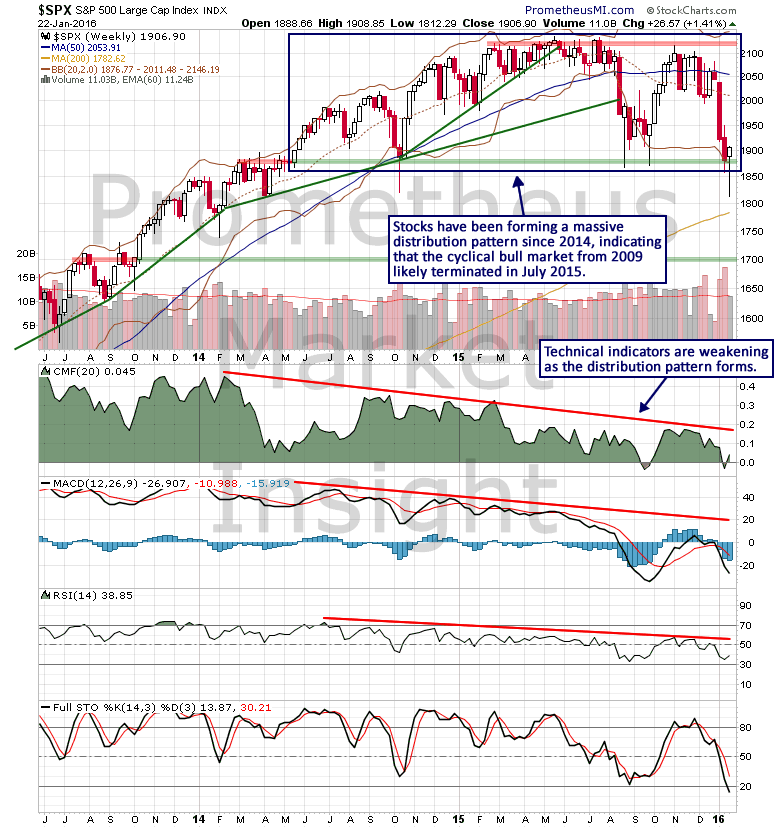
S&P 500 Weekly Chart

The next significant technical development that would effectively confirm the start of a new cyclical downtrend would be a weekly close well below congestion support in the 1,880 area. However, it will be important to monitor the development of the latest short-term cycle that began last week. On Wednesday, our computer models predicted the likely formation of a short-term low, and the subsequent cycle low signal on Friday confirmed that a new cycle had begun.
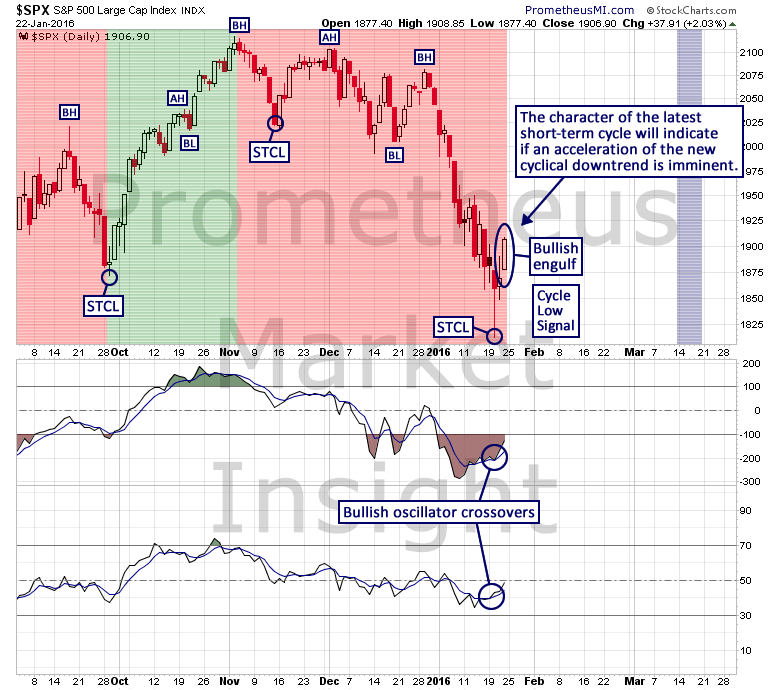
S&P 500 Daily Chart

The character of the initial phase of this new short-term cycle will indicate if the cyclical downtrend from 2015 is preparing to accelerate. Therefore, it will be important to monitor stock market behavior carefully during the next several weeks.

3rd party Ad. Not an offer or recommendation by Investing.com. See disclosure here or remove ads .

Latest comments

Risk Disclosure: Trading in financial instruments and/or cryptocurrencies involves high risks including the risk of losing some, or all, of your investment amount, and may not be suitable for all investors. Prices of cryptocurrencies are extremely volatile and may be affected by external factors such as financial, regulatory or political events. Trading on margin increases the financial risks.
Before deciding to trade in financial instrument or cryptocurrencies you should be fully informed of the risks and costs associated with trading the financial markets, carefully consider your investment objectives, level of experience, and risk appetite, and seek professional advice where needed.
Fusion Media would like to remind you that the data contained in this website is not necessarily real-time nor accurate. The data and prices on the website are not necessarily provided by any market or exchange, but may be provided by market makers, and so prices may not be accurate and may differ from the actual price at any given market, meaning prices are indicative and not appropriate for trading purposes. Fusion Media and any provider of the data contained in this website will not accept liability for any loss or damage as a result of your trading, or your reliance on the information contained within this website.
It is prohibited to use, store, reproduce, display, modify, transmit or distribute the data contained in this website without the explicit prior written permission of Fusion Media and/or the data provider. All intellectual property rights are reserved by the providers and/or the exchange providing the data contained in this website.
Fusion Media may be compensated by the advertisers that appear on the website, based on your interaction with the advertisements or advertisers.
© 2007-2024 - Fusion Media Limited. All Rights Reserved.