Jeff: Joining me on the Stock Exchange is my colleague Todd E. Hurlbut, CMT, Chief Investment Officer at Incline Investment Advisors, LLC. Todd is the creator of the Emerald Bay model featured in this column. He is known as “Trending Todd.” And yes, that is a hint about his trading style.
Summary
We want to be right most if not all the time. Our egos are tied into how we are perceived by others. Investing and trading can be a humbling business because what we expect to happen, no what we “know” will happen, often does not. The reality, however, is that nobody has a crystal ball. Nobody on CNBC is more clairvoyant that anyone on Bloomberg or anyone watching at home for that matter. Fortunately, successful investing doesn’t require us to be right all the time but instead to be able to find a repeatable process compatible with our personality. While intuition comes with experience, wishing something will happen is a dangerous place from which to invest. Holding onto losing positions that you “know” will come back is a difficult position to overcome with rational thought. After all, thinking you “know” what will happen in the future is anything but rational. In Ben Carlson’s article “Bull Markets Last Longer Than You Think”, he discusses the length of bull markets throughout history.
“…what we can learn from history is that bull markets tend to run for much longer than most investors would ever think is possible.”
This is the most disliked bull market in my career, I “knew” it was over in 2015, yet fortunately stuck to a process that keeps me invested despite what I wish would’ve happened at the time.
The Stock Exchange is all about trading. Each week, we do the following:
Discuss an important issue for traders,
Highlight several technical trading methods, including current ideas,
Feature advice from top traders and writers, and
Provide a few (minority) reactions from fundamental analysts.
We also have some fun. We welcome comments, links and ideas to help us improve this resource for traders. If you have some ideas, please join in!
Review: Asking ‘Why?’ Can be a Big Mistake
Our previous Stock Exchange discussed separating the news from what’s happening in the markets Asking ‘Why?’ Can be a Big Mistake. Successful long-term investing and trading often requires us to ignore the news and instead focus on the process and the price action of the instruments in our portfolio. Understanding the reason why a stock is rising or falling can be counterproductive and only obvious after the fact.
This Week:
In the same vein, following the longest bull market in modern US History one would expect the most severe bear market in modern US History. Once again, logic and what one “knows” to be true is often not the case in investing, Carlson goes on
“When you experience above-average returns like that you should expect below-average returns to follow. That’s plain common sense. But bull markets don’t follow the rules of common sense. They’re built on momentum, emotion and the fear of missing out.”
The most successful investors invest with their process and disregard their desires and what they “wish” their positions would do. As they know for certain, the markets do not care.
Expert Picks from The Models
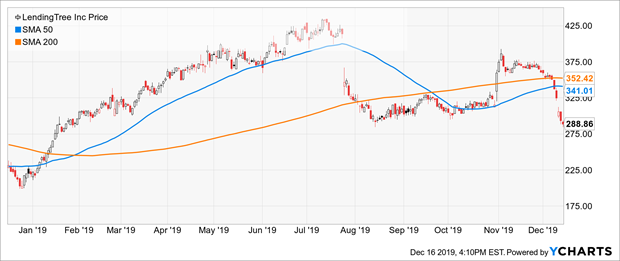
Holmes: I bought shares of Lendingtree Inc (NASDAQ:TREE) on December 11th at $299.10 and sold them on December 12th for $303.52.
TT: How do you feel about the trade?
Holmes: I purchased for technical reasons. Specifically, I am a dip buyer, and I like to buy attractive pullbacks, as you can see in the chart above. It earned over 1.5% in a day which are the objectives of the program.
TT: I see the pullback you’re talking about.
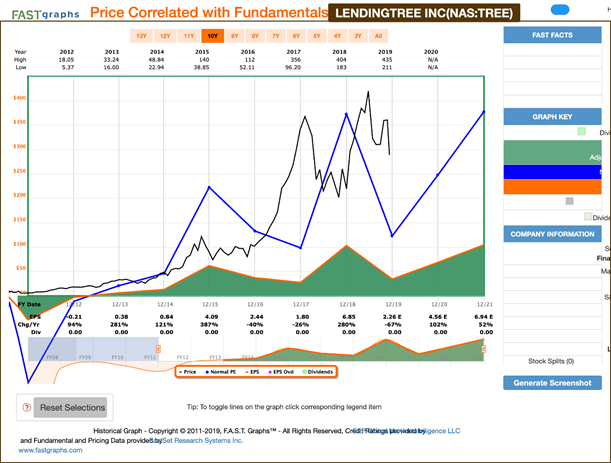
Holmes: As a technical trader, with a holding period of a few days to a few weeks, I don’t care too much about long-term fundamentals. I’m already out of the trade.
TT: I principally care about an attractive price chart and a stock trading near recent highs. Anyway, thanks for sharing this trade, Holmes. And how about you, Athena–any trades to share this week?
Athena: I bought shares of Bed Bath & Beyond Inc (NASDAQ:BBBY) on December 13th.
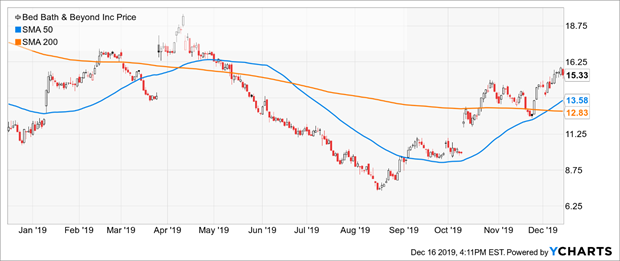
TT: Looks like a sharp rally from a V shaped bottom.
Athena: I look for stocks having strong positive trends and then select only those with the very strongest trends (“king of the hill”), constantly replacing the ones with weaker trends. It should not surprise anyone that I bought Bed Bath and Beyond Inc. A quick look at the chart should make the strength of the trend obvious. And I generally continue to hold my positions until either the strength of the trend abates or a stock with an even higher trend strength comes along. I don’t have a set “holding period” for a position. I will exit only when either a stronger stock comes along or if market conditions dictate a strong potential for loss – capital preservation remains the key driver in all situations.
Jeff: This idea has support from the fundamentals. The FASTgraphs chart does not look like a Wile E. Coyote rerun.
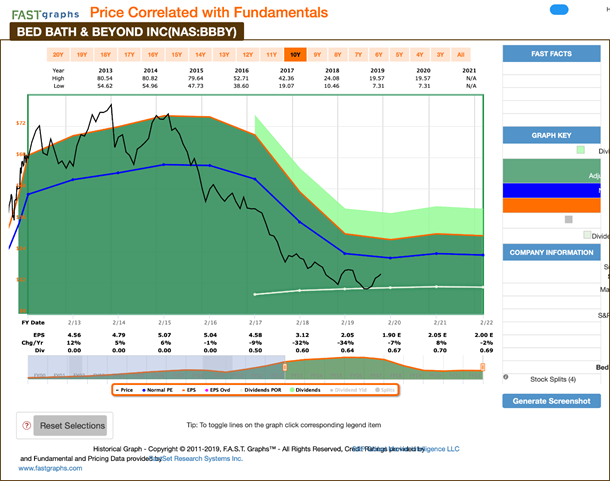
TT: The stock has certainly been strong since the Summer, thanks for sharing. And how about you, Road Runner?
Road Runner: I recently purchased shares of Insulet Corporation (NASDAQ:PODD) on December 13th.
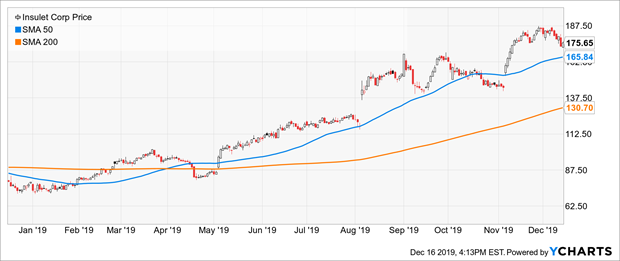
TT: Why’d you buy it?
RR: I like to buy attractive momentum stocks in the lower end of a rising channel, as you can see in the following chart.
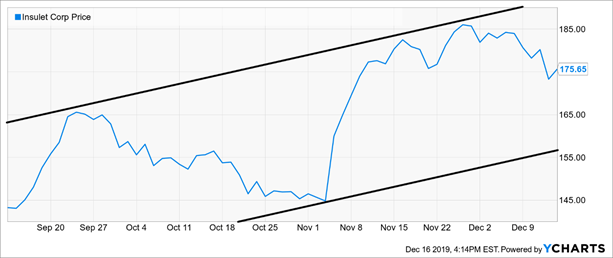
TT: It seems like a strong stock at the midpoint of a rising channel and trading near a multiyear high price. Attractive stock indeed.
RR: That’s correct. There are a few more data points that go into each trade, but essentially, yes–you got it.
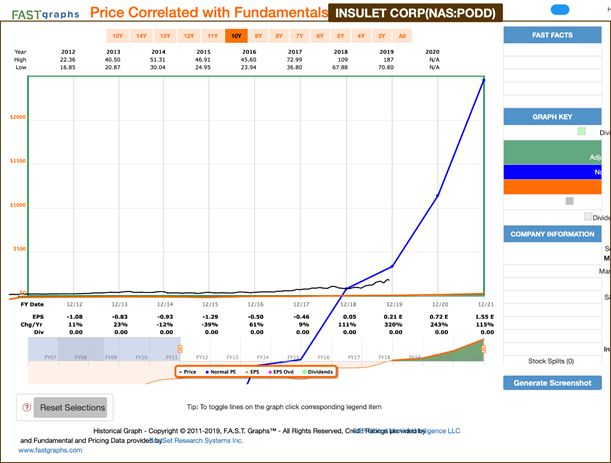
TT: Okay, I think this trade has potential. Thanks for sharing. And how about you, Emerald Bay–any trades to share this week?
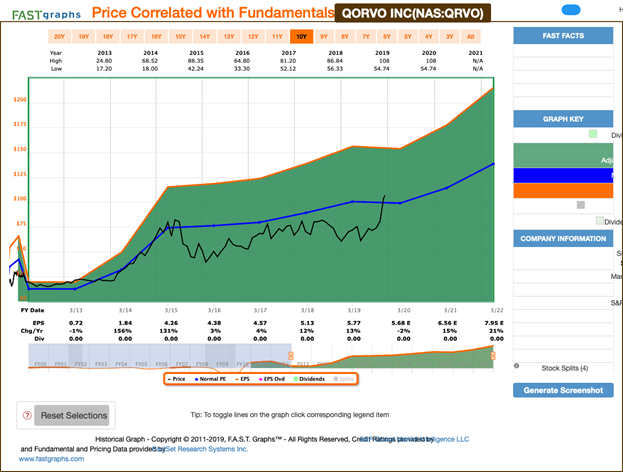
Emerald Bay: I bought shares of Qorvo Inc (NASDAQ:QRVO) on December 11th.
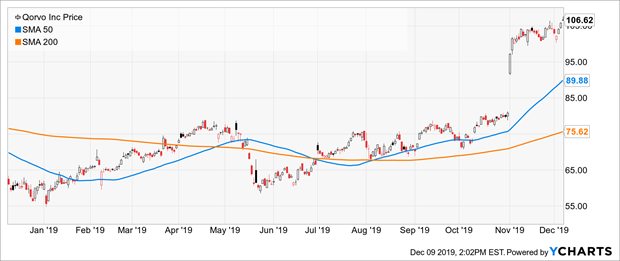
TT: It looks like these shares have been basing much of 2019 and gapped up in November before you purchased.
EB: I seek exposure to the highest momentum names in our large cap equity universe, adjusted for volatility. Specifically, I like to base my position sizes on volatility with more capital invested in the less-volatile stocks.
TT: You’ve been doing quite well since purchasing this position and I suspect you’ll hold it until the trend changes. Thank you for sharing.
Jeff: Are you concerned about the dependence on 5G and possible trade war effects?
TT: Not directly. We expect and concerns to be reflected in technical factors like price and volume.
Jeff: Let’s look at the fundamentals with the basic chart from FASTgraphs. For a change from your normal picks, fundamental investors can join in. This is in spite of the price, not because of it!
Conclusion
Nobody knows what the future holds. Investing like you “know” what will happen in the future to the positions in your portfolio is dangerous indeed. Focus on refining your process and investing according to how the markets are behaving… right now.
