
The Stock Exchange is all about trading. Each week we do the following:
- Discuss an important issue for traders;
- highlight several technical trading methods, including current ideas;
- feature advice from top traders and writers; and,
- provide a few (minority) reactions from fundamental analysts.
We also have some fun. We welcome comments, links, and ideas to help us improve this resource for traders. If you have some ideas, please join in!
Review:
Our previous Stock Exchange asked the question: Are You Trading The Energy Sell-Off? We considered the energy sector’s continued underperformance, and compared that to the ongoing strength of technology and momentum stocks in particular. The year-to-date divergence persisted through this Thursdays sell-off, and a glance at your news feed will show that the key points remain relevant.
This Week: How Long Was Your Learning Curve?
No matter how great your natural abilities, it takes a lot of practice to become good at something. For example, newbies can’t shoot par on their first ever round of golf, and traders cannot become consistently profitable without a lot of practice. And even after a lot of practice, it’s still not for everyone (this is why everyone that loves golf cannot be on the PGA tour). Similarly, according to world renowned trader, Charles E. Kirk:
Over 90% of investors/traders… would be better off adopting passive strategies such as “lazy portfolios”, which are not actively managed and relieve the investor of almost all decision-making (thus the term “passive” rather than “active”).
The only thing the 90% plus have to learn is passive portfolio management, i.e. how to match the market’s overall performance.
And for more perspective, according to a study referenced by Dr. Brett Steenbarger:
Over 80% of traders were unprofitable in the study and, after expenses, only a small proportion were profitable. Not surprisingly, the smallest traders tended to be the least successful. The larger ones, of course, were large precisely because they had accumulated some degree of success.
For us, our models were developed using 20 years of data—first training and then out-of-sample testing. The real-time period is post learning curve. For example, Holmes had over 40,000 possible choices in the training period and 30,000 in the OOS phase. That is a lot of “experience.”
Two of the factors we’ve learned to watch in our trading is the short-term and long-term technical health of the market, as reported in WTWA. And even after a day like yesterday, our short-term indicators remain “neutral” (when that is the rating, we still expect to be able to trade profitably, but we are obviously monitoring very closely).

Model Performance:
Per reader feedback, we’re continuing to share the performance of our trading models.

We find that blending a trend-following / momentum model (Athena) with a mean reversion / dip-buying model (Holmes) provides two strategies, effective in their own right, that are not correlated with each other or with the overall market. By combining the two, we can get more diversity, lower risk, and a smoother string of returns.
And for these reasons, I am changing the “Trade with Jeff” offer at Seeking Alpha to include a 50-50 split between Holmes and Athena. Current participants have already agreed to this. Since our costs on Athena are lower, we have also lowered the fees for the combination.
If you have been thinking about giving it a try, click through at the bottom of this post for more information. Also, readers are invited to write to main at newarc dot com for our free, brief description of how we created the Stock Exchange models.
Expert Picks From The Models:
This week’s Stock Exchange is being edited by Blue Harbinger.
Road Runner: This week, I bought shares of Amazon (NASDAQ:AMZN) on 3/19. I know you love this stock and you’re addicted to this company, Blue Harbinger, correct?

Blue Harbinger: A lot of people love Amazon, including yourself, Road Runner—I recall you also bought shares of Amazon on 2/5 also, correct?

RR: That is correct. As you’ll see in the two charts above, I like to buy stocks at the lower end of a rising channel, and then I typically hold them for about 4-weeks. And true to my style, I sold the 2/5 shares 4-weeks later on 3/5. Here is a look at what Amazon did during my 4-week holding period.

BH: Not bad Road Runner—you appear to have made a very healthy profit on that last trade. I appreciate that you held on through the big market sell-off in early February. And perhaps ironically, the market just sold-off again yesterday—a few days after you purchased. Will you stick to your 4-week holding period on this latest Amazon purchase too?
RR: I’ll stick to the 4-week period, unless something dramatic happens that moves Jeff’s short-term technical outlook from neutral to negative, as was discussed earlier in this article. And thank you for noticing my strong profits on my previous Amazon trade.
BH: Here’s a look at the Fast Graph (below) for Amazon—if you’re interested in digging a little deeper than just technicals. You know Amazon Web Services dominates in cloud now, with Microsoft Azure a distant second place. Plus Amazon just overtook Alphabet (NASDAQ:GOOGL) in market cap, after also surpassing Microsoft (NASDAQ:MSFT) earlier this year.

RR: Thanks. Amazon is a real juggernaut. I am aware of the fundamentals, but I’ll stick to my technical approach. It took me a long-time to build my skills and style. And now that I’m having success—that’s why my assets under management (“AUM”) have grown.
BH: Well I’ll be checking back in with you on this Amazon trade in about 4-weeks, Road Runner. The shares sold-off on Thursday (as did just about everything else), and they’re continuing to sell-off in afterhours and Friday’s pre-market, but the big sell-off in February didn’t deter your profits. Anyway, how about you Holmes—what have you got this week.
Holmes: No trades this week. Even though Jeff’s short-term technical health indicators are still neutral, as long as they’re not negative, I expect to be able to find trades—just nothing tickled my fancy this week.
BH: Ok. Thanks. How about you, Felix—anything to share?
Felix: Yes. This week I ran the NASDAQ 100 ETF QQQ through my model, and the top 20 are included in the following list.
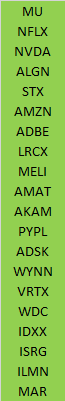
BH: I like most of the names in your top 10, although Micron (NASDAQ:MU) makes me nervous because it’s so cyclical (they just announced expectation-beating earnings this week, by the way), and Seagate (NASDAQ:STX) makes me nervous too because it seems local hard drives will be challenged since everything is moving to the cloud—STX bonds might be worth considering though.
Felix: Thanks for your opinions, BH. How about you Oscar—Do you have anything for us this week?
Oscar: Yes. This week I ran the high volume ETF universe through my model, and the following list shows my top 20 ETFs
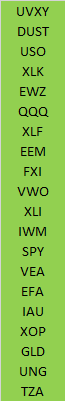
BH: It always cracks me up because your ETFs are always so diverse. I suppose what they have in common this week is high volume and momentum that you expect to continue for the next 6-weeks—that’s your typical holding period, correct?
Oscar: Correct. And I usually just rotate to a new sector ETF after that time period. However, Jeff continues to monitor the overall short-term technical conditions, especially after Thursday’s sell-off. And if the indicator drops from its current “neutral” level to “negative,” then there is a process that may trigger me to exit my positions.
Conclusion:
How long did it take you to develop a trading style that works? Was the learning curve steep? Most traders are not masters from day 1, and that’s why they usually start with small trading accounts before moving up to higher levels. We’ve developed a process that works for us over many years, and one of the things we’ve learned is to monitor short-term technical health, especially when the market gets choppy. We continue to view conditions as neutral, which means we can keep trading. However, we also continue to watch market conditions closely after Thursday’s sell-off.
Background On The Stock Exchange:
Each week, Felix and Oscar host a poker game for some of their friends. Since they are all traders, they love to discuss their best current ideas before the game starts. They like to call this their “Stock Exchange.” Their methods are excellent, as you know if you have been following the series. Since the time frames and risk profiles differ, so do the stock ideas. You get to be a fly on the wall from my report. I am usually the only human present and the only one using any fundamental analysis.
The result? Several expert ideas each week from traders, and a brief comment on the fundamentals from the human investor. The models are named to make it easy to remember their trading personalities.
Stock Exchange Character Guide:

Getting Updates:
Readers are welcome to suggest individual stocks and/or ETFs to be added to our model lists. We keep a running list of all securities our readers recommend, and we share the results within this weekly “Stock Exchange” series when feasible. Send your ideas to “etf at newarc dot com.” Also, we will share additional information about the models, including test data, with those interested in investing. Suggestions and comments about this weekly “Stock Exchange” report are welcome.