
The Stock Exchange is all about trading. Each week we do the following:
- Discuss an important issue for traders;
- highlight several technical trading methods, including current ideas;
- feature advice from top traders and writers; and,
- provide a few (minority) reactions from fundamental analysts.
We also have some fun. We welcome comments, links, and ideas to help us improve this resource for traders. If you have some ideas, please join in!
Review:
Our previous Stock Exchange asked the question: Do You Keep A Shopping List Ready? We considered the reality that a variety of market leading stocks had sold-off in recent weeks, but asked the question “how do you distinguish between buying opportunities and red flags?” Maintaining a “shopping list” was one suggested solution. Additionally, multiple comments on the article suggested using “good ‘til cancelled” orders was worthwhile for some. A glance at your news feed will show that the key points remain relevant.
This Week: Are You A Contrarian Trend Follower?
There are periods and market conditions under which certain trading strategies work relatively well and relatively less well. For example, Warren Buffett (an investor, not a trader) once used the concept of the “three I’s” to explain the natural progression of how a good new idea can go wrong. According to this interview with Buffett:
First come the innovators, who see opportunities that others don’t. Then come the imitators, who copy what the innovators have done. And then come the idiots, whose avarice undoes the very innovations they are trying to use to get rich.
In the case of trend following, whether you are early or late can make all the difference in the world. For example, according to this recent article by Mark Rzepczynski:
The best time to buy [a performance trend] is when returns are low and the best time to sell is when performance is high. Be a trend-following contrarian. There is evidence that this approach works.
It seems Mr. Rzepczynski is suggesting that if you’re going to be a trend follower, get in early (as an innovator) before the trend is already delivering big returns. And when a trend is delivering big relative returns, that’s the time to consider your exit.
Alternatively, Rzepczynski suggests another approach is to passively implement your trend following strategy. Specifically:
The trend-following properties of diversification should lead to a constant allocation.
However, investors should be aware…
there will come times when strong performance will be reversed or at least the return to risk will turn down. Similarly, there will periods when poor performance will be reversed because risk-taking is reduced or the period of no trends is finished.
If you’re going to implement a trend following strategy, thinking like a contrarian can be very helpful, as paradoxical as that may sound.
Model Performance:
Per reader feedback, we’re continuing to share the performance of our trading models. Keep in mind, as alluded to above, every trading method has strongest and weakest times. Our group is excellent in a big market decline, since it has a signal for a complete exit. They also work well in flat or rising markets, effectively capturing individual stock gains. In some sense, the current time is “in between.” The models would be doing better if the market action was either better or worse
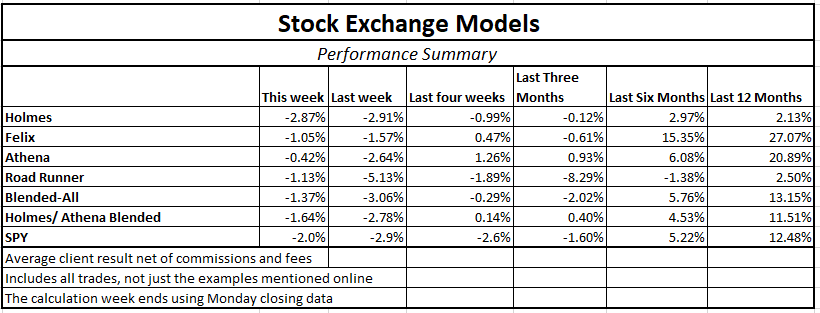
Over time, we find that blending a trend-following / momentum model (Athena) with a mean reversion / dip-buying model (Holmes) provides two strategies, effective in their own right, that are not correlated with each other or with the overall market. By combining the two, we can get more diversity, lower risk, and a smoother string of returns.
And for these reasons, I am changing the “Trade with Jeff” offer at Seeking Alpha to include a 50-50 split between Holmes and Athena. Current participants have already agreed to this. Since our costs on Athena are lower, we have also lowered the fees for the combination.
If you have been thinking about giving it a try, click through at the bottom of this post for more information. Also, readers are invited to write to main at newarc dot com for our free, brief description of how we created the Stock Exchange models.
Expert Picks From The Models:
This week’s Stock Exchange is being edited by Blue Harbinger; (Blue Harbinger is a source for independent investment ideas).
Holmes: This week I reduced my position in Stamps.com (NASDAQ:STMP). If you recall, I purchased these shares on 3/1 for $189.50, and I sold about 15% of the holdings on 3/29 for $200.80.
Blue Harbinger: Interesting move, Holmes. What happened—you don’t like internet based shipping solutions anymore?
Holmes: I typically hold for about 6 weeks (this trade was slightly less), and I exit when my price target is achieved or based on Macro conditions. Here is a look at the one -year technical chart as well as the 4-week chart for STMP showing the hold period and sale of the stock this week.
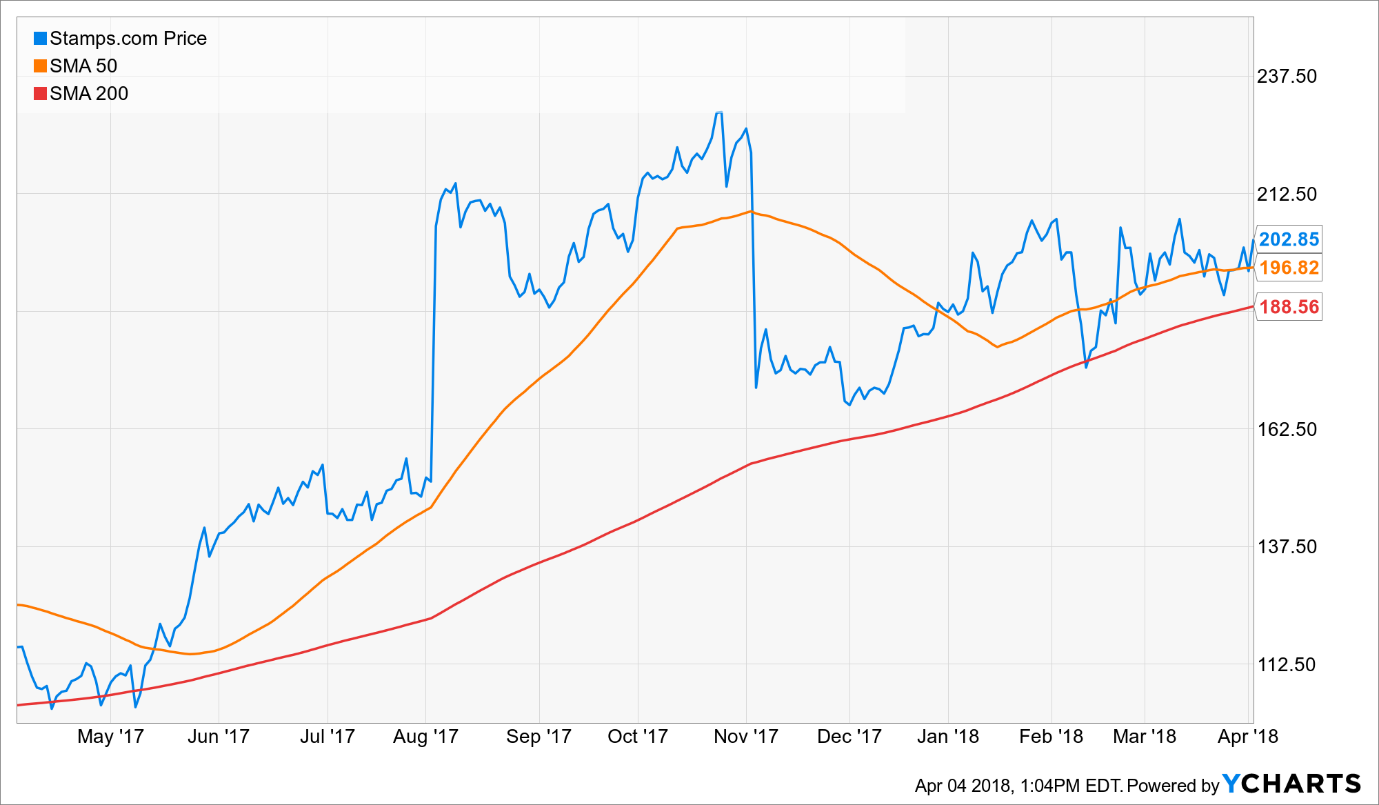
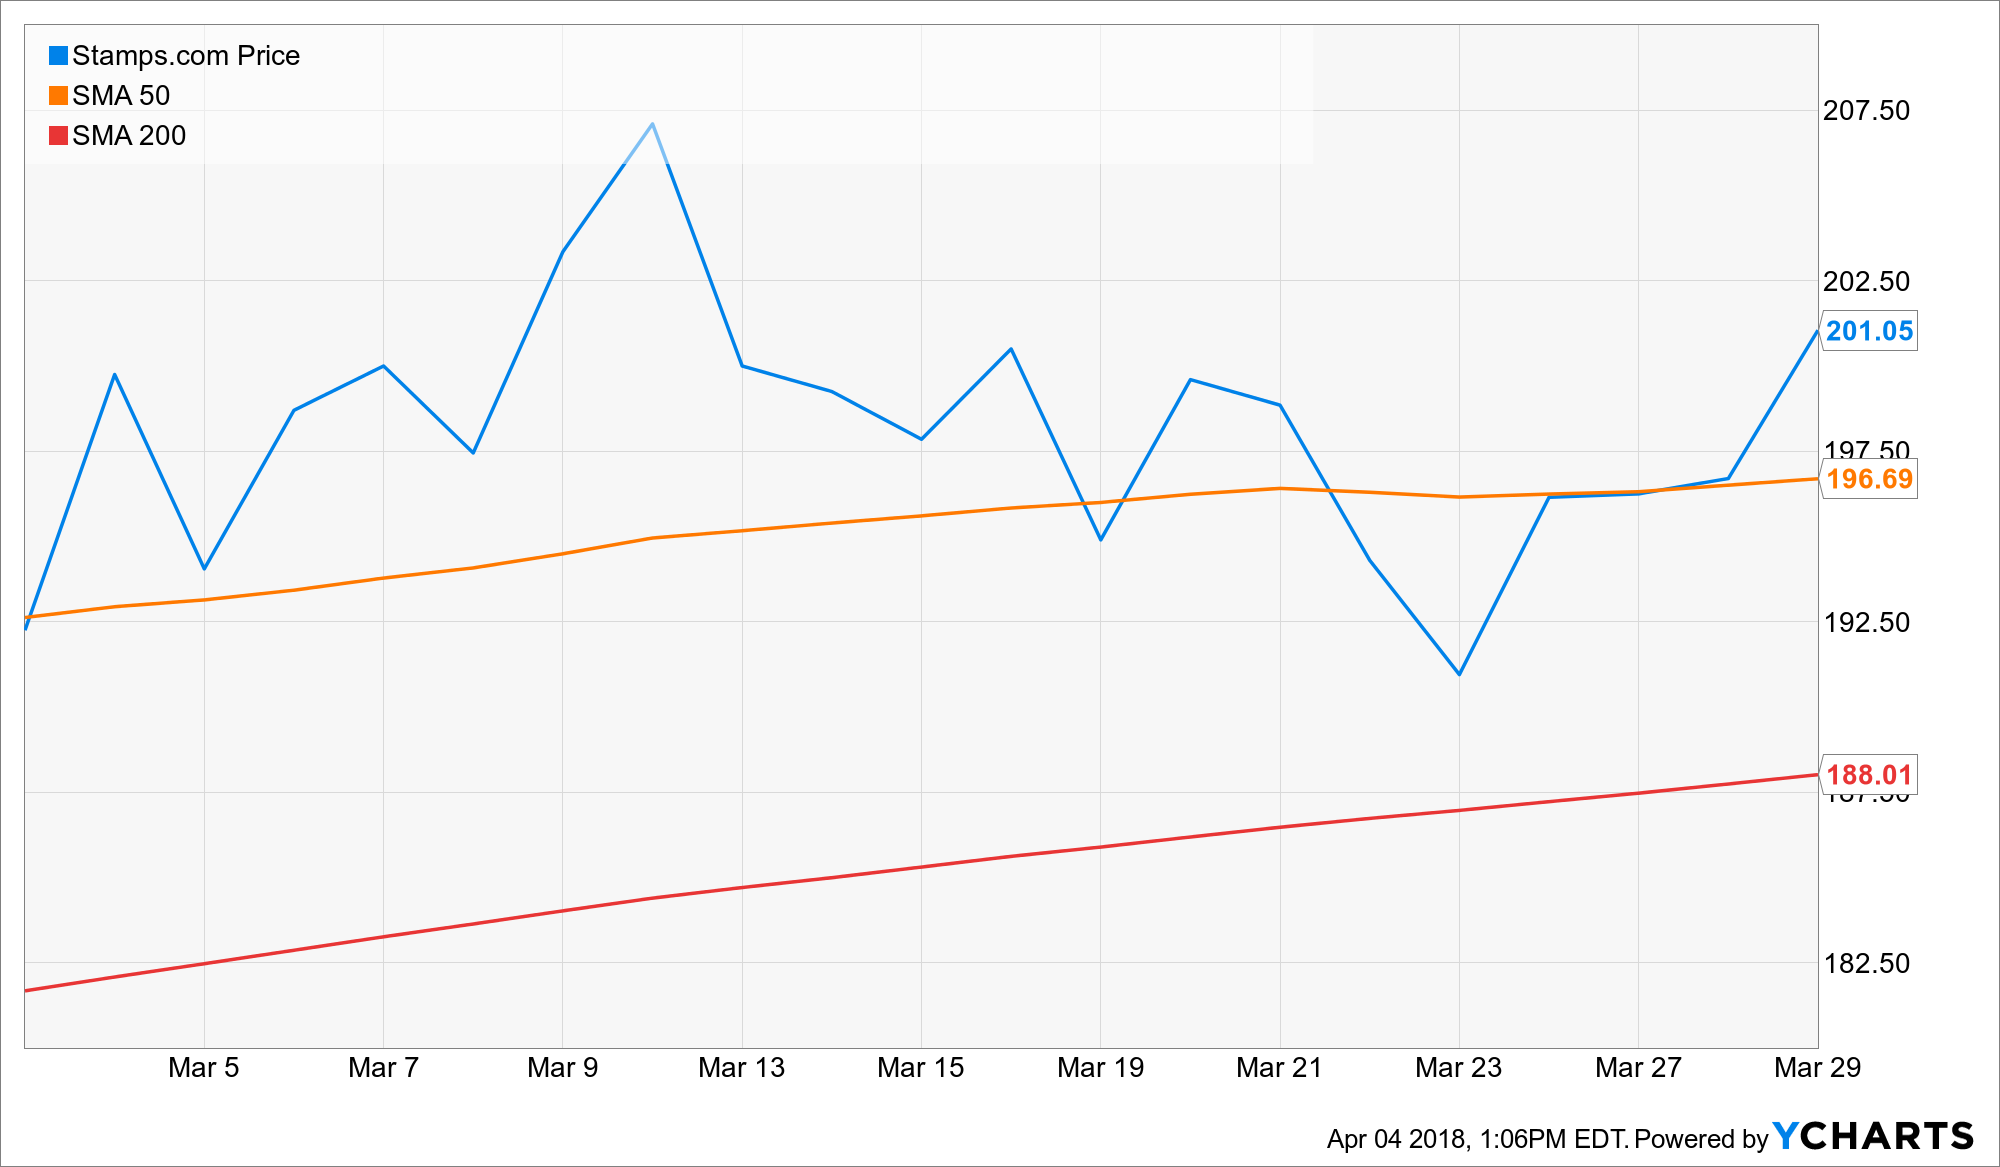
BH: It looks like you made some money—not a lot, but in these market conditions a profit is a profit. The stock tends to be fairly volatile, especially considering the company’s history of beating quarterly earnings expectations (as shown below), and I see the dip you bought.

Homes: That is correct, I am a dip-buyer. And I typically hold for about six-weeks.
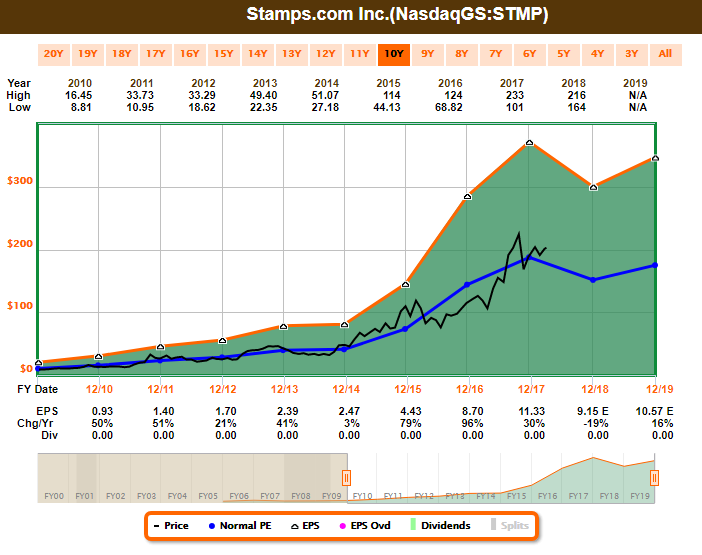
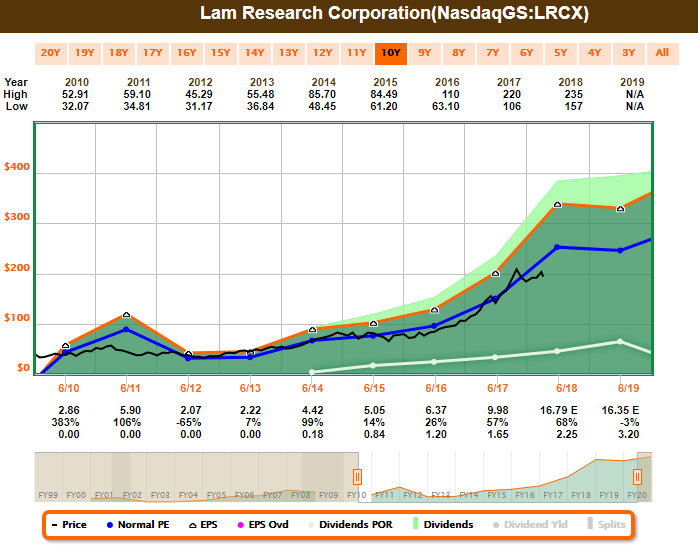
BH: Here is a look at the FastGraph for STMP. This company has been moving in the right direction.
Holmes: Let’s hope it keeps moving in the right direction, considering I’m still holding more shares. Anyway, how about you Road Runner—any trades this week?
Road Runner: Yes. This week I sold semiconductor company, Lam Research (NASDAQ:LRCX). I bought these shares on 03/01 for $ 193.86, and sold them on 03/29 for $200.75.
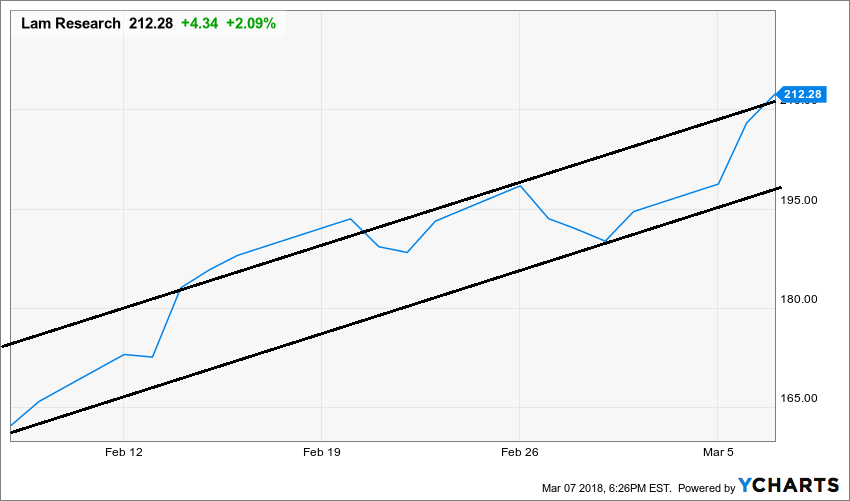
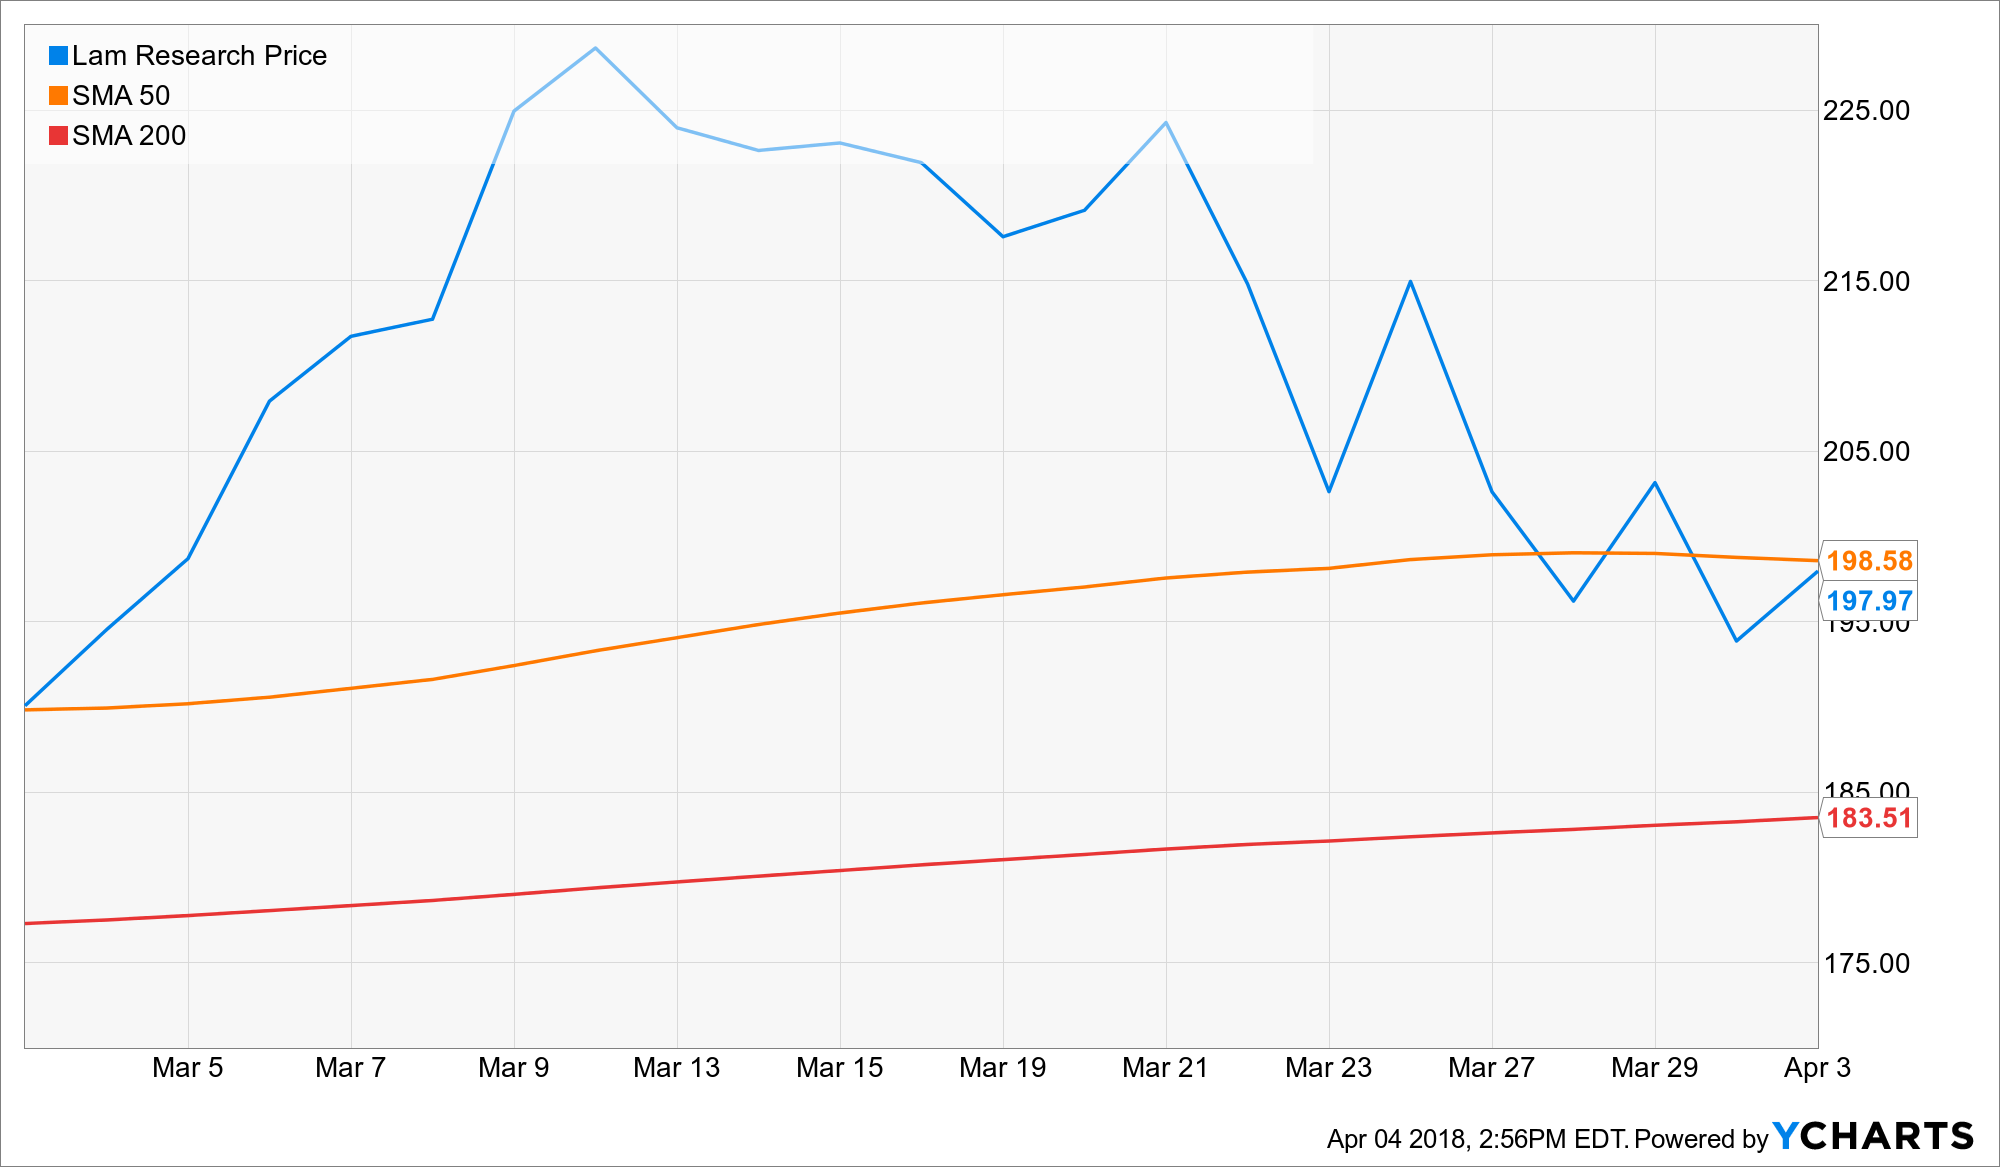
BH: Nice one, Road Runner—looks like another profitable trade. But why did you sell?
Road Runner: I hold momentum stocks for 4-weeks. STMP was up during that time period, and I exited at a profit.
BH: Okay—that’s straight forward enough. How about you Athena—did you actually buy or sell anything this week?
Athena: Yes—I bought shares of XL Group (NYSE:XL) this week on 4/2. Are you familiar with the company?

BH: Yes, XL Group is an insurance and reinsurance company. And you are aware that AXA (PA:AXAF) agreed to buy XL Group for approximately $57.60 per share, correct Athena? That’s why the price leaped in March.
Athena: Yes—I am aware, I bought the shares at a lower price on Monday, essentially locking in a decent return between the current price an the acquisition price, assuming the deal goes through.
BH: Very interesting, Athena. Completion of the transaction is still subject to approval by XL Group shareholders and other customary closing conditions, including the receipt of required regulatory approvals, and is expected to take place during the second half of 2018.
Athena: I am aware of that too. I expect the share price to approach the deal price in the coming weeks. It’s basically upside with very little downside risk.
BH: I’ll be keeping an eye on this one. Thanks for sharing, Athena. And how about you, Felix—do you have anything to share this week
Felix: Yes, this week I ran the list of S&P 400 Midcap stocks through my model, and I have included the top 20 rankings in the following list.
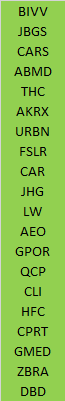
BH: Thanks for sharing, Felix. Remind us, what type of trader are you?
Felix: I am a momentum trader. I hold my positions considerably longer than the other traders—typically around 66 weeks. And I exit when my price target is achieved. I also use macro factors and some customized stop orders for risk management purposes.
BH: I see you have a REIT at #2—JBG Smith Properties (NYSE:JBGS). This company owns and operates mainly office building assets in the Washington DC area. Seems like an attractive high-demand area, considering there is no shortage of politicians and pundits in Washington DC.
Felix: Thanks. How about you, Oscar—what do you have for us this week?
Oscar: This week I ran the high-volume ETFs through my model, and I’ve included the top 20 rankings in the following list.
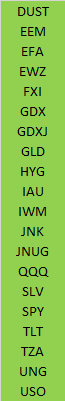
BH: I see EEM, EFA and EWZ near the top of your list. These are all international ETFs from iShares (one emerging markets (EEM), one developed markets (EFA), and one Brazil ETF (EWZ)). What is it you like about these ETFs, Oscar?
Oscar: I too am a momentum trader, however I only hold my positions for about 6-weeks before rotating into something else. All three of the ETFs you mentioned have attractive upside potential during that time period.
BH: I like those ETFs because iShares manages them efficiently, and keeps the costs low. Plus it’s not a bad idea to have some non-US diversification.
Oscar: I’m not interested in them for the diversification. I like them because they have upside in the coming weeks.
BH: Thanks Oscar, I’ll keep an eye on these ETFs, and then check back with you in a few weeks.
Conclusion:
Trading strategies perform differently under different market conditions. However, it can be a mistake to simply follow whatever strategy has been working best lately, as that strategy my be closer to the end than to the beginning of its relative success. It is possible to be a contrarian trend follower, in the sense that trends that have been working best often revert toward the mean, while those that have been performing less well often revert back to better performance. Identifying trends early, as well as being conginzant of when they’re winding down, can be important keys to success.
Background On The Stock Exchange:
Each week, Felix and Oscar host a poker game for some of their friends. Since they are all traders, they love to discuss their best current ideas before the game starts. They like to call this their “Stock Exchange.” (Check out Background on the Stock Exchange for more background). Their methods are excellent, as you know if you have been following the series. Since the time frames and risk profiles differ, so do the stock ideas. You get to be a fly on the wall from my report. I am usually the only human present and the only one using any fundamental analysis.
The result? Several expert ideas each week from traders, and a brief comment on the fundamentals from the human investor. The models are named to make it easy to remember their trading personalities.

Getting Updates:
Readers are welcome to suggest individual stocks and/or ETFs to be added to our model lists. We keep a running list of all securities our readers recommend, and we share the results within this weekly “Stock Exchange” series when feasible. Send your ideas to “etf at newarc dot com.” Also, we will share additional information about the models, including test data, with those interested in investing. Suggestions and comments about this weekly “Stock Exchange” report are welcome.
Trade Alongside Jeff Miller: Learn More.