If I put the pandemic aside and ignore the current jobs picture there are many reasons that I am bullish stocks. Housing continues to remain upbeat with sales near all-time highs and consumer confidence is rising, which means investors’ sentiment will continue to trend higher. What is most important is that stocks that have outperformed in 2020 will likely continue to outperform. So my goal is to focus on the winners and avoid the laggers.
The Election Does Not Matter
It seems clear that investors don’t seem to care who wins the election. Biden is up in the polls, and even though he has repeatedly said that he will raise taxes, the market does not seem to care. If Biden wins he will sign a huge stimulus bill and likely go for an enormous infrastructure spending bill that will propel stocks even higher. If President Trump is reelected, I also expect a stimulus bill with an eventual tax cut. While at Walter Reed Hospital, President Trump tweeted that if he wins he will push for the biggest tax cut in history. The bottom line is that regardless of who wins the presidency, stock prices are likely to continue to trend higher and ignore the weakening economic climate.
Large Cap Tech and New Economy Stocks Will Continue to Outperform
What is clear is that the spread of COVID-19 has a stranglehold on businesses and shoppers. This has led to the outperformance of large-cap tech shares like Amazon (NASDAQ:AMZN), Apple (NASDAQ:AAPL), Microsoft (NASDAQ:MSFT), and Google (NASDAQ:GOOGL). It has also propelled stay at home stocks such as Zoom (NASDAQ:ZM), Peloton (NASDAQ:PTON), and Netflix (NASDAQ:NFLX).
Large-cap tech shares have gained substantial market capitalization and their continued outperformance will be the impetus that drives the broader markets. In both market-cap-weighted indexes (like the S&P 500 index) and price-weighted indices (like the Dow Industrial Average), large-cap tech shares have become the key drivers of the value of these indices.
Stay with Clean Energy and Discard Dirty Energy
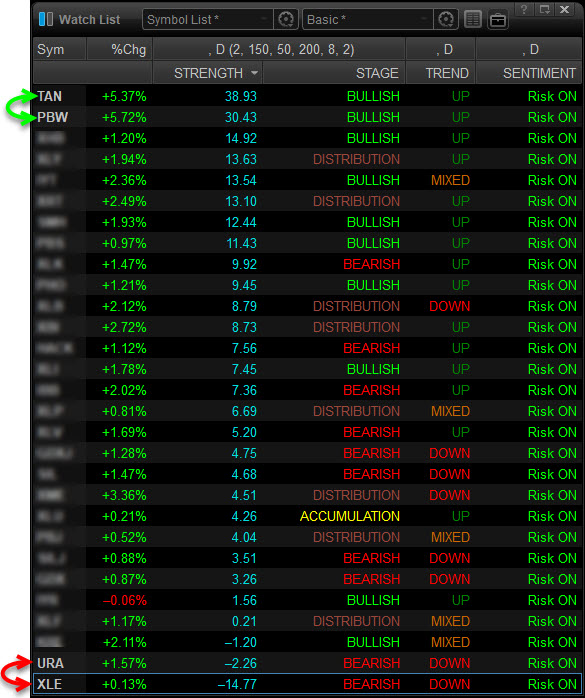
An interesting sub-sector in the energy space that has been silently leading the way higher are solar stocks. Invesco Solar ETF (NYSE:TAN) is a solar exchange-traded fund that has significantly outperformed every other asset. Another is the clean energy Invesco WilderHill Clean Energy ETF (NYSE:PBW). These two are the BAN (Best Asset Now)
The worst performing sector in the S&P 500 index is the XLE, which is considered dirty energy. Second worst performer is the URA which holds uranium equities which is also considered dirty energy.
The way I evaluate stocks is by using a (Best Asset Now) BAN strategy where I focus on owning leaders and discarding laggards. I have found that over time, stock/sectors that have been leading the broader markets for 3-4 months have a 70% probability to continue to trend higher. That is why I like to own them on a breakout or buy them on oversold dips.
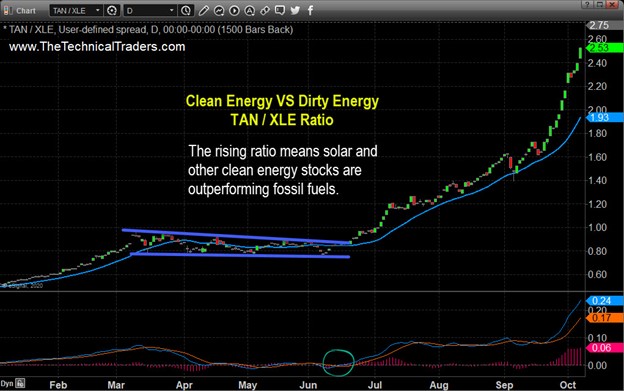
Daily Clean VS Dirty Energy Ratio Chart
The way I evaluate the trend is to look at a chart of the outperformers as a ratio to the underperformers.
When I look at the chart of TAN/XLE (clean energy divided by dirty energy), I can see that the ratio has broken out and has increased more than 4-fold so far in 2020. Since breaking out in June, the ratio has revisited the 20-day moving average of the ratio 3-times, and each time the ratio bounced and accelerate higher. The momentum on the ratio is positive. The MACD (moving average convergence divergence) generated a crossover buy signal in late September.
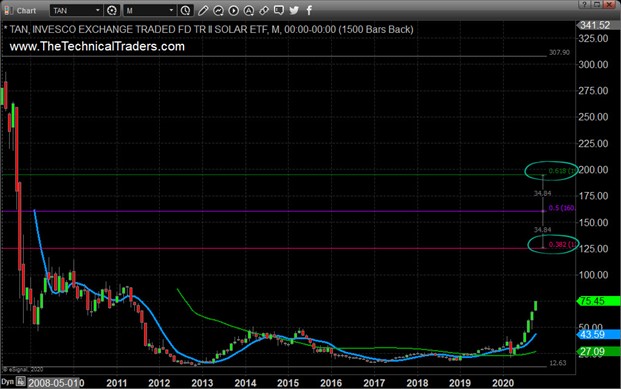
Monthly Solar Stock Sector Performance
The monthly chart of TAN shows there is a lot of room to rally before key target resistance. The Fibonacci retracement level from the highs made in 2008 to the lows made in 2013 shows that a 38.2% retracement level is at $125.96. If the price of TAN can clear the 38.2% retracement level the next stop could be the 61.8% retracement level near $195.38. The 20-month moving average of TAN crossed above the 50-month moving average of TAN which means that a long-term uptrend is now in place.
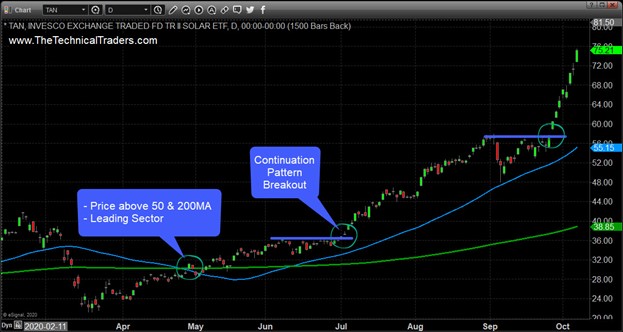
TAN Solar Breakout Daily Chart
TAN broke out in late September and has not looked back. After gaping through and closing above the key 50 and 200 moving averages, the price climbed in a steady and sustailable rate. Since gapping above the $58 resistance leve the price has surged higher on heavy volume.
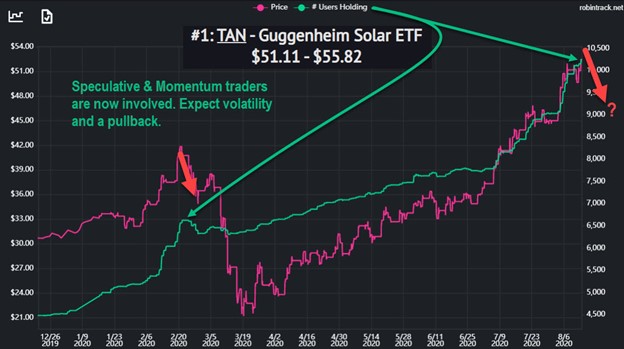
RobinHood Traders Piling Into TAN Clean Energy Sector
Take a look at this chart below which shows the price of TAN in pink, and the number of traders who own this ETF in green. The key takeaway from this chart is that when we see short-term speculative traders piling into an asset as they did during February, and again now, you should expect wild price swings and some type of pullback in the near future that could last a few weeks or months.
Concluding Thoughts
In short, clean energy is likely to continue to outperform the broader market’s energy regardless of who wins the Presidency, but there may be a few bumps to avoid over in the near term. If I put the pandemic aside, and focus on the positive aspects of the economy, there are a lot of reasons to be bullish stocks. While clean energy has been the leader up until now, new sectors are starting to show signs of new leadership.
Congress is eventually going to pull the trigger on another stimulus bill which will ignite a new bull trend I would expect. My strategy is to use (BAN) Best Assets Now, evaluating sectors for who we should be looking to own.
