AI valuation crash is the biggest market risk in 2026, Deutsche Bank survey finds

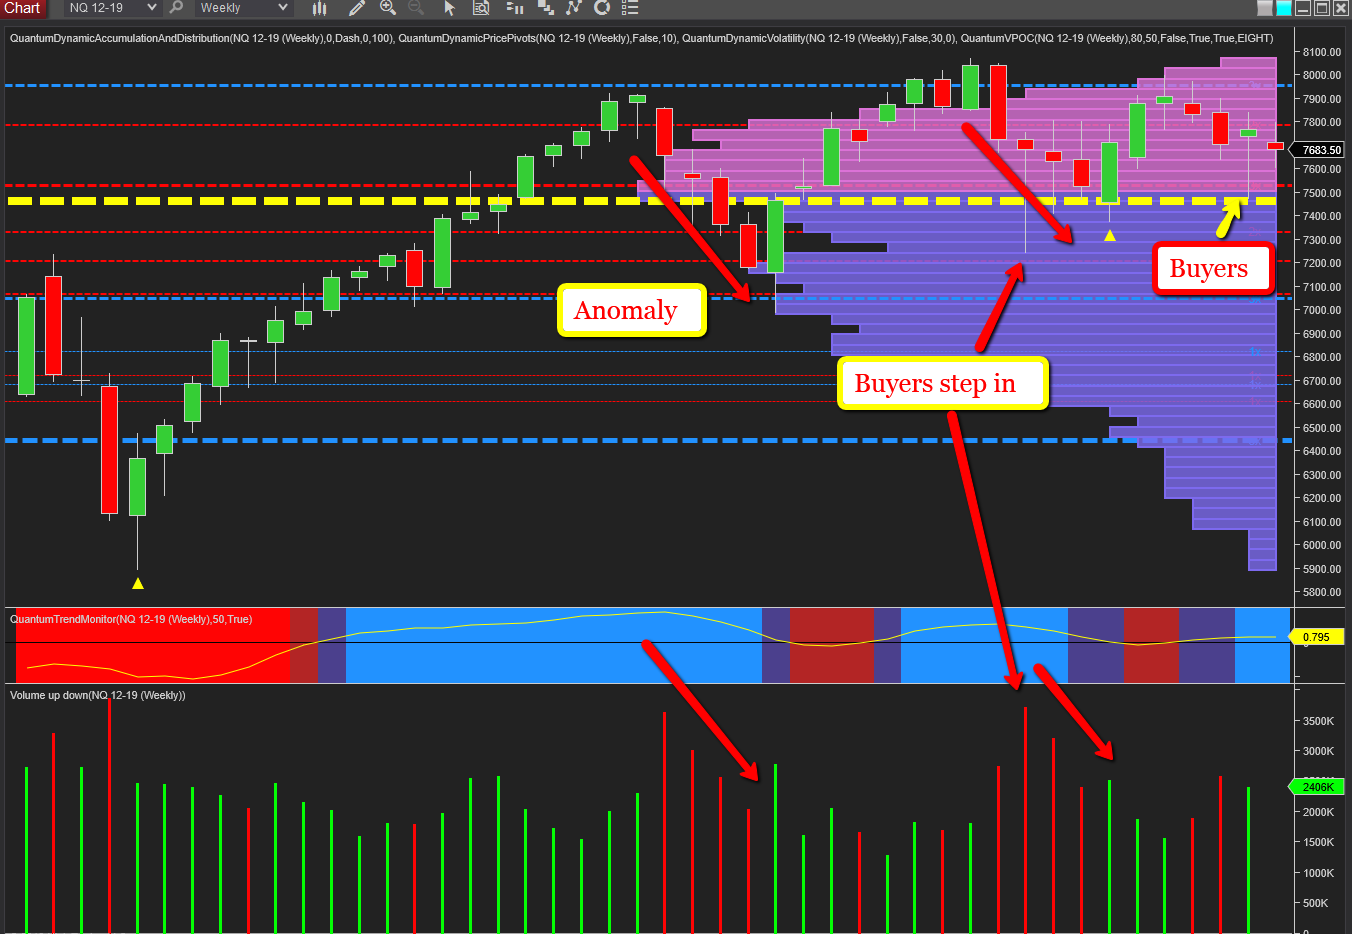
As I have already highlighted in other recent posts and analysis, when markets are in congestion with volatility, as has been the case for many over the last two months, it helps to step down to the weekly chart to smooth out the price action and so offer a more considered analysis. And this is certainly the case as far as the primary US indices are concerned, all of which continue to oscillate dramatically driven by politics and Donald Trump, with the NQ emini representative of both the YM emini and also the ES emini. But as always it is volume price analysis, which highlights the way ahead.
And if we start with those periods of heavy selling in May and August, both exhibit the same pattern of volume behavior, with the price action falling, but associated with falling volume. This is a classic vpa signal as markets require effort to both rise and fall. Therefore a falling market on falling volume is anomalous since we should see rising volume if such a move is to develop into a significant price waterfall. On both occasion this was not the case, with each move duly running out of steam and reversing into a rally higher. However, these two have their own problems, and here again the price action was anomalous with each rally associated with falling volume and therefore lacking conviction.

The attempts to rally in late August and early September were classic where three weeks of rising price action was associated with falling volume, so the resulting fall came as no surprise to volume price analysis traders and. This was followed by two weeks of rising price action in before the buyers stepped in last week on high volume as the price action also tested the volume point of control which sits at 7450 and denoted with the yellow dashed line. This price action and volume reflects a similar phase in early August as the buyers stepped in before the weak rally developed, so perhaps we can expect the same once again over the next few weeks with a short term return of bullish sentiment. If so, the various levels will then come into play with resistance at 7960 denoted with the blue dashed line of the accumulation and distribution indicator which has defined recent attempts to rally.
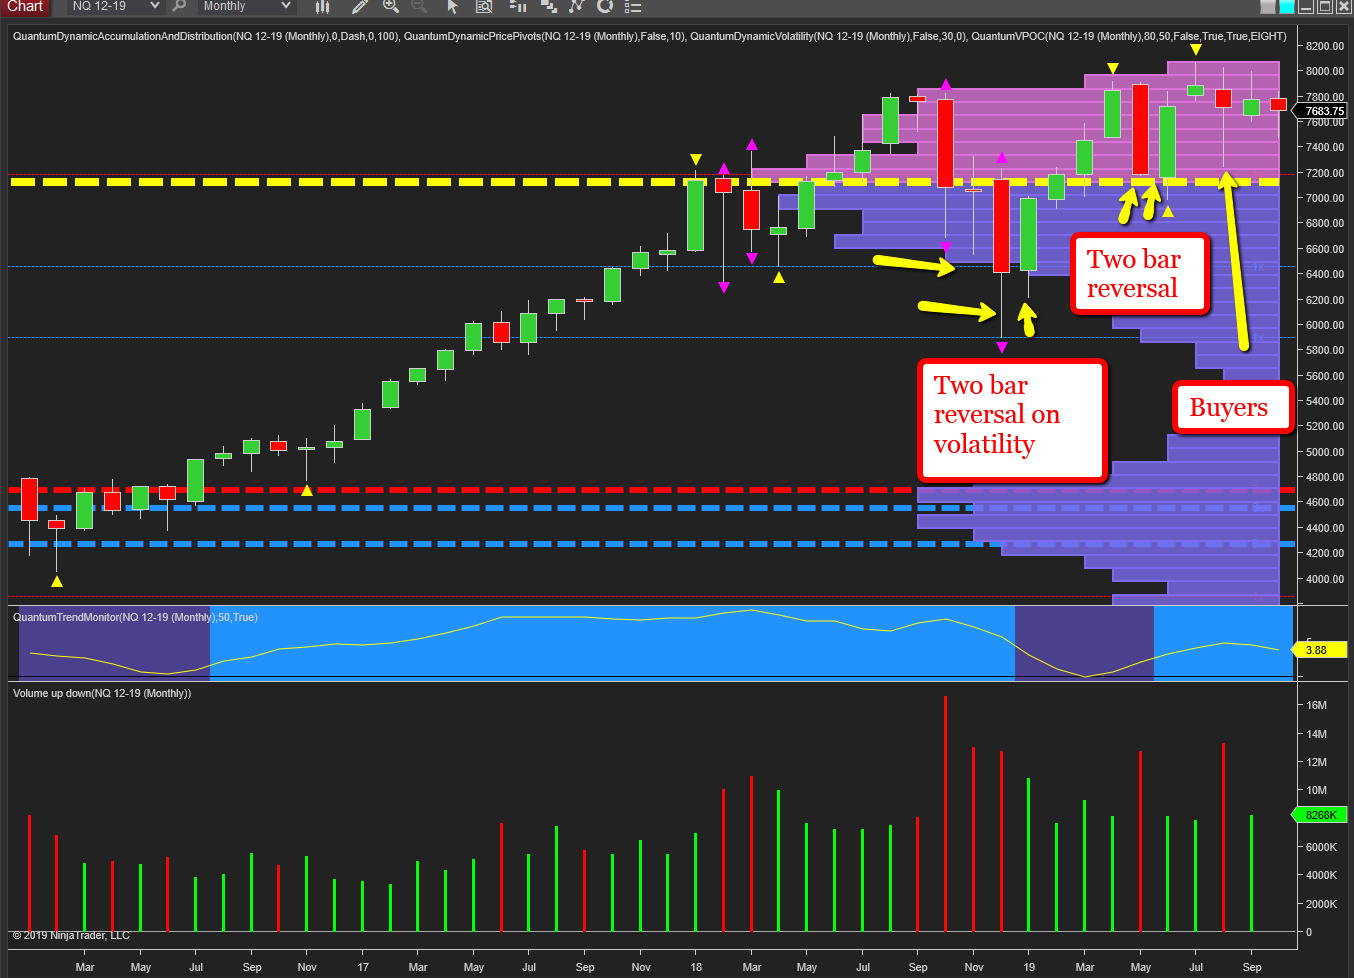
Longer term it is the psychological 8,000 level which will ultimately define a return of the bullish trend once markets break away from this extended phase of price congestion which has seen the NQ oscillate in a 1000 point range. Some have suggested we are witnessing a climactic top and the pre-cursor to the development of a long term bearish trend. However, my own view based on an analysis of the monthly chart would suggest otherwise. And the reason is we do not have candles with deep upper wicks which are symptomatic of heavy selling into weakness and indeed are seeing the opposite with bullish two bar reversals and candles with deep lower wicks on heavy volume, as was the case three months ago.
