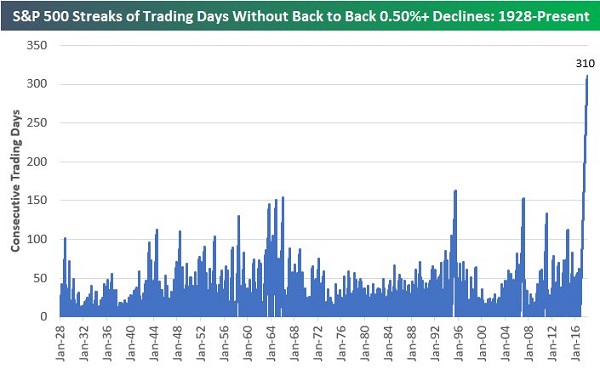
The U.S. stock market has rarely notched 150 trading days without back-to-back 0.5%-plus declines. It happened on one occasion prior to the financial crisis in 2007. It also occurred once in the mid-1990s and twice in the 1960s.
More recently, the S&P 500 logged an additional streak for consecutive trading sessions. This time, however, 150 days did not serve as the high-water mark. Nor was it 200 or 250 days.
The new record streak that culminated on January 30, 2018? Try 300-plus consecutive sessions without back-to-back 0.5%-plus declines. That’s more than DOUBLE anything witnessed across the last 90 years.
Many media personalities describe the current stock equanimity in terms of a paradigm shift. I do not. Just as a “New Economy” failed to justify the insanity of the 2000 stock bubble at the turn of the century, the recent suppression of market volatility does not represent a permanent plateau of higher prices.
One of the primary reasons for the extended period of market calm has been the influence of central bank asset purchases (a.k.a. “QE” or “quantitative easing”). As the world found itself on the precipice of bearish stock price decimation two years ago (01/16), global central banks supercharged their stimulus by injecting trillions of additional liquidity.
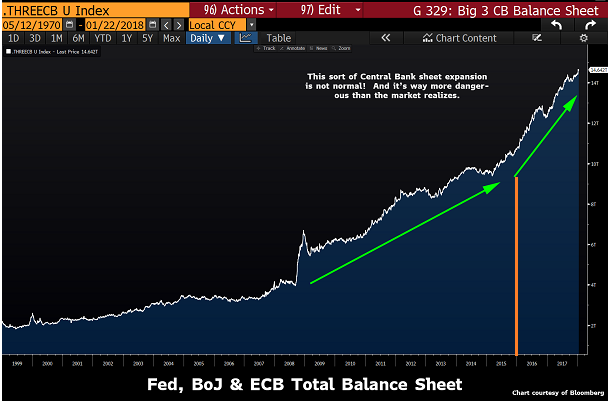
Keep in mind, there is an exceptionally high correlation between the pace of central bank balance sheet expansion and stock prices. Specifically, the faster the rate of balance sheet growth, the higher prices have climbed on very little volatility. The slower the rate of balance sheet growth, or the absence of growth altogether, the less success stocks have had.
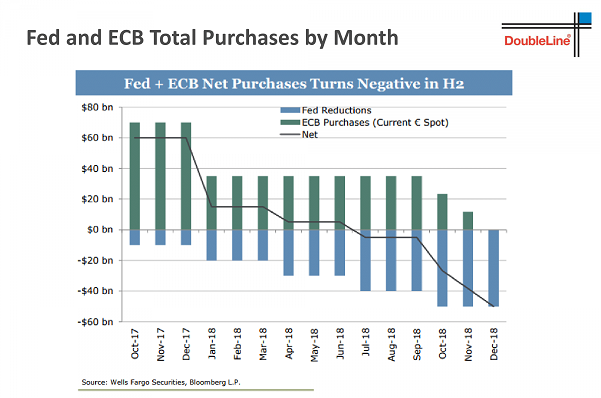
Creating a wealth effect where higher asset prices might lead businesses and households toward greater consumption is precisely what central banks around the world set out to do. Unfortunately, by the second half of 2018, Federal Reserve and European Central Bank net purchasing activity will turn negative. This places a whole lot of pressure on the tax reform package to pick up the stimulus slack.
Speaking of the tax reform package, David Rosenberg of Gluskin Sheff crunched some numbers. In particular, S&P 500 companies may be keeping an additional $100 billion in 2018. Yet the stock market has tacked on $1.5 trillion in market capitalization. That’s a multiple of 15! At the same juncture in the the 1986 tax overhaul? The multiple was 2.5.
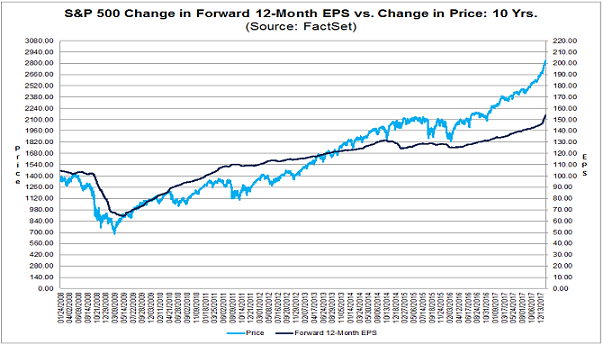
It is stimulus from tax cuts on top of stimulus from central banks. Yet the latter is shifting toward a tightening stance and the former is largely priced in. Even with the tax cuts, the Forward P/E on GAAP earnings is 20.0; it is 18.6 for non-GAAP manipulated earnings. Even employing the generous non-GAAP data, the Forward P/E of 18.6 is roughly 24% above the 10-year mean.
Richard Russell, the renowned Dow Theorist, was correct in explaining that a stock market can do absolutely anything over short periods of time. He was equally accurate in expressing that the greatest certainty over longer periods is regression to the mean.
Perhaps the question is not if or when reversion will occur. Rather, when it takes place, how much depreciation will investors be looking at? For instance, a reasonable expectation based on forward price-to-earnings data might be a 25% bearish downturn whenever regression to the mean comes to pass.
On the other hand, if one is more inclined to incorporate profit margins and GDP into the cyclically-adjusted price-to-earnings ratio (PE10), as Michael Lebowitz of 720 Global does, then stock overvaluation has never been more extreme. Again, valuations cannot predict near-term returns. Nevertheless, they do a great deal of rhyming with subsequent 10-year results.
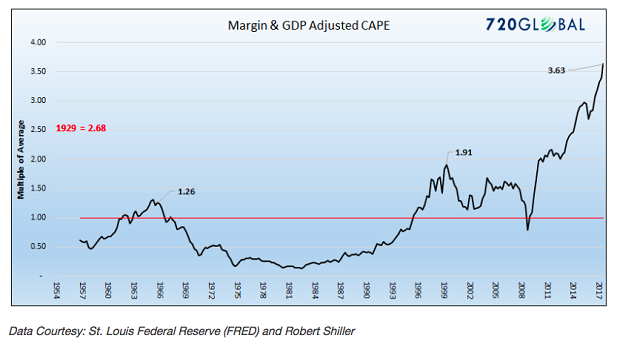
Put another way, investors are forking over 3x the average, or mean, for a dollar of economic growth. That number could get even worse if tax cuts do not enhance gross domestic product as much as many anticipate.
Consider the sharp drop from 3.3% to 2.6% in the personal savings rate. According to Glusken Sheff’s Rosenberg, had the personal savings rate remained the same, instead of falling from 3.3% to 2.6%, GDP would have been a paltry 0.6% in Q4 2017. GDP actually came in at a modest 2.6%.
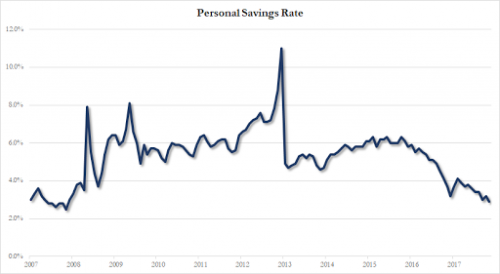
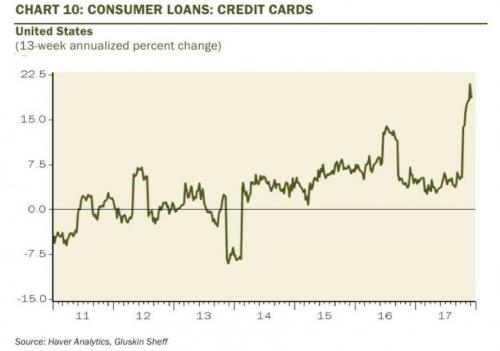
It gets more troublesome. Even with wage gains, full unemployment, and a seemingly robust economy, Americans continue to spend more than they make. On top of non-existent savings, credit card balances have climbed through the rafters.
One of the more disquieting aspects of these economic realities is that investors have never been more bullish on stocks than they are right now. Many of them have been trained to think that their retirement accounts can recover from any downturn. Dot-com bubble, real estate subprime crisis… bring it on!
But what if these investors are miscalculating? What if a market correction is not a short-lived event that can be reclaimed in a year, or three or five?
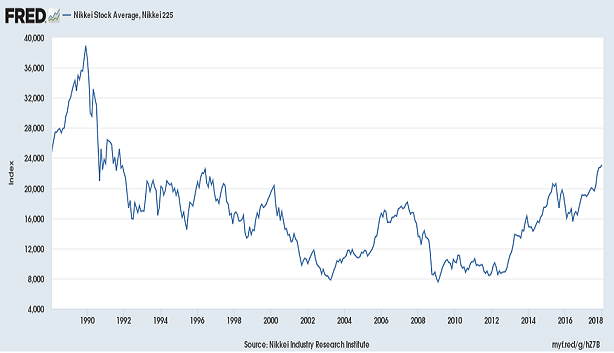
Consider a developed economy that used to be the 2nd largest in the world (it is currently #3.) This country’s stock market collapsed nearly 30 years ago. And after close to three decades since 1990, has the hold-n-hope retiree from this country been rewarded for patience and extreme confidence? Hardly. Japan’s stock market is still 40% beneath its record peak.
My recommendations at this point in the bull portion of the bull-bear cycle is twofold. First, you can continue to ride the technically powerful uptrend with an appropriate equity mix for your risk tolerance as long as the monthly close on the 10-month SMA remains above its trend. If the monthly close breaks below its trend, however, reduce your stock exposure to a level that will allow you to sleep at night. Personally, I might cut the exposure by half.
Second, recognize what it will take for the central banks to bolster economies in the next economic downturn. In the 2000 quagmire, we watched the overnight lending rate stateside go from 6.25% down to 1%. In the 2008 financial crisis, the Fed Funds rate went from 5.25% to 0%, yet that was not even enough. We also required approximately $3.75 trillion in QE stimulus.
It follows that the Fed’s normalization plans to make it to 2.75% in this tightening cycle still leaves the institution without adequate ammunition. Almost assuredly, upon hitting the zero bound on the way back down, they will be forced to employ some combination of negative interest rates and additional QE policies. The biggest winners? Those with the cash and the borrowing wherewithal to profit from a 2% 30-year fixed rate mortgage.
Remember, the 1980s served up a 10% 30-year fixed rate mortgage. We experienced the 8% 30-year in the 1990s, the 6% mortgage in the 2000s, and the 4% 30-year fixed rate mortgage here in the 2010s. Plan now to profit from the 2% 30-year fixed rate mortgage of the 2020s with a stash of 1.5%-2% yielding cash equivalents.
Disclosure Statement: ETF Expert is a web log (“blog”) that makes the world of ETFs easier to understand. Gary Gordon, MS, CFP is the president of Pacific Park Financial, Inc., a Registered Investment Adviser with the SEC. Gary Gordon, Pacific Park Financial, Inc., and/or its clients may hold positions in the ETFs, mutual funds, and/or any investment asset mentioned above. The commentary does not constitute individualized investment advice. The opinions offered herein are not personalized recommendations to buy, sell or hold securities. At times, issuers of exchange-traded products compensate Pacific Park Financial, Inc. or its subsidiaries for advertising at the ETF Expert website. ETF Expert content is created independently of any advertising relationship.
