SPY Trends And Influencers May 11, 2019
Last week’s review of the macro market indicators saw with another FOMC meeting in the books and the April employment report behind, equity markets were strong and moving higher again. Elsewhere looked for Gold ($GLD) to continue lower in its pullback while Crude Oil ($USO) joined it as it turns lower. The US Dollar Index ($DXY) was also reversing lower while US Treasuries ($TLT) reversed to the upside.
The Shanghai Composite ($ASHR) ended its short week pulling back but Emerging Markets ($EEM) were now poised to reverse back higher. Volatility ($VXXB) looked to remain at very low levels keeping the bias higher for the equity index ETF’s $SPY, $IWM and QQQ. Their charts all looked strong on the weekly timeframe. On the daily timeframe it looked like the QQQ was ready to consolidate while the IWM took over the lead, with the SPY driving higher as well.
The week played out with Gold holding steady while Crude Oil churned sideways in consolidation. The US Dollar weakened moving slightly lower while Treasuries continued to the upside. The Shanghai Composite gapped below key support and continued down until a late week bounce while Emerging Markets lost support and dropped to 2 month lows.
Volatility rose out of stagnation, putting a negative bias on equities. The Equity Index ETF’s all reacted by moving lower, after some initial strength Monday. The SPY and QQQ bore the brunt of the drop with the IWM holding up the best. What does this mean for the coming week? Let’s look at some charts.
SPY Daily, $SPY
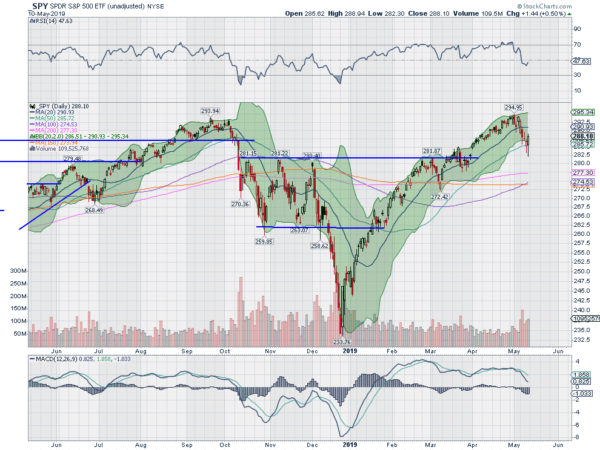
The SPY came into the week just under the all-time highs after a bounce off of the 20-day SMA. Monday saw a gap down open, under that 20 day SMA, but then strong intraday price action to close only slightly lower. But it did not last, Tuesday dropped again and it followed lower Wednesday and Thursday, reaching the 50 day SMA for the first time since January.
Friday saw a move lower early in the day, closing the gap opened April 1st, and then a strong reversal to end up on the day. The daily chart shows the bullish engulfing candle Friday and the RSI turning back up, as it remained in the bullish zone. The MACD is leveling and positive as well. This could be the end of the pullback.
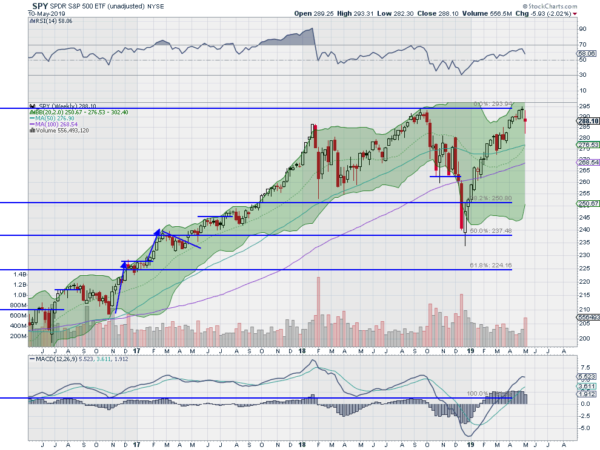
The weekly chart sports a candle with long shadows on both ends, lots of indecision. The RSI is turned over and falling in the bullish zone with the MACD leveling and positive. There is resistance from 289.50 to 290.50 then at 292 and 294. Support lower comes at 287 and 285 then 284 and 282. Pullback in Uptrend.
SPY Weekly, $SPY
Heading into the May options expiration week equity markets have reset lower, but ended the week strong. This suggests the pullback may be ending. Elsewhere look for Gold to pause in its downtrend while Crude Oil continues to pullback in the uptrend. The US Dollar Index looks to continue to move sideways while US Treasuries are biased to continue higher.
The Shanghai Composite may be ending its pullback while Emerging Markets are biased to the downside in the short run. Volatility looks to settle back after a pop higher, easing the pressure on the equity index ETF’s SPY, IWM and QQQ. Their charts show decent resets lower in the SPY and QQQ with the IWM back in its range. Use this information as you prepare for the coming week and trad’em well.
The information in this blog post represents my own opinions and does not contain a recommendation for any particular security or investment. I or my affiliates may hold positions or other interests in securities mentioned in the Blog, please see my Disclaimer page for my full disclaimer.