Stocks Are “Overbought” In 2017
On February 17 the S&P 500’s weekly RSI reading closed above 70, which may appear to be a red flag for the stock market based on common terms associated with RSI. From stockcharts.com:
Developed J. Welles Wilder, the Relative Strength Index (RSI) is a momentum oscillator that measures the speed and change of price movements. RSI oscillates between zero and 100. Traditionally, and according to Wilder, RSI is considered overbought when above 70 and oversold when below 30.
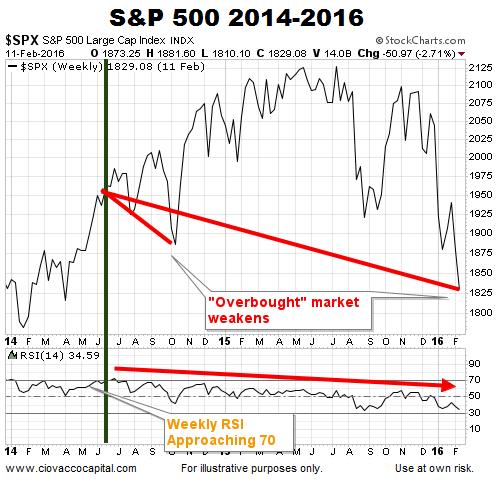
Stocks Were “Overbought” In 2014
We can find numerous examples in history when the S&P 500 struggled after weekly RSI approaches 69-to-70 (overbought), including the 2014-2016 example below.
In this post, we will address one question and one question only:
Is it in the realm of historical possibility for overbought markets to remain overbought for long periods of time while posting impressive gains and avoiding significant pullbacks?
Is An “Overbought” Reading A Showstopper?
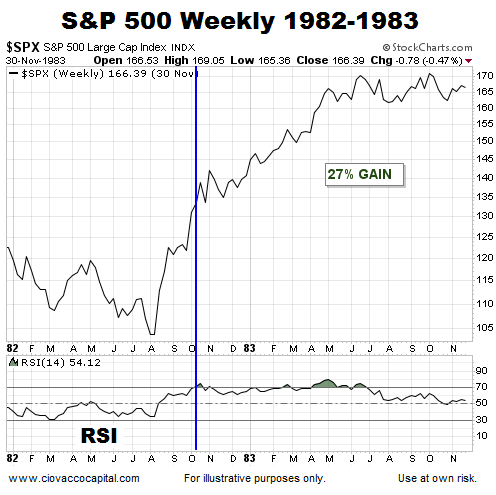
There are numerous examples from history when positive trends in stocks were not derailed after weekly RSI approached 69-to-70. The early 1980s were marked by strong bullish trends. When trends are strong, the S&P 500 can continue to rise for some time after weekly RSI nears “overbought” status. As shown in the chart below, after high weekly RSI readings in 1982, the S&P 500 gained an additional 27% before experiencing a significant pullback.
Stocks Continued To Rise In 1985
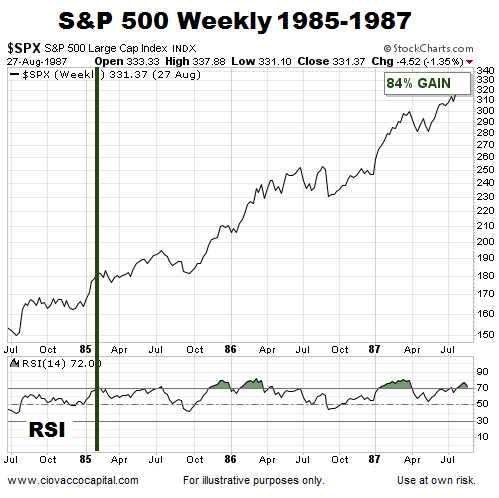
While stocks did stall for a time, no significant trend derailment occurred after weekly RSI neared 70 early in 1985; instead, stocks tacked on an additional gain of 84%.
High RSI Readings Were Not Bearish Late In 1985
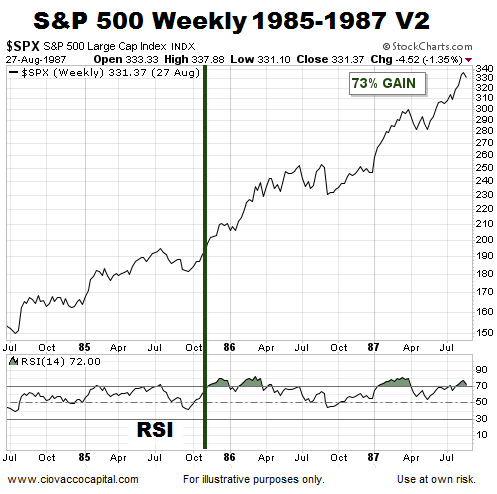
If we decided to play it safe in October 1985 due to weekly RSI readings approaching “overbought” territory, we would have missed a strong trend that resulted in additional gains of 73%.
Another Chance In 1986
After a pullback in early 1986, another “overbought” decision had to be made as weekly RSI raced back above 70. Instead of killing the rally, it continued for quite some time.
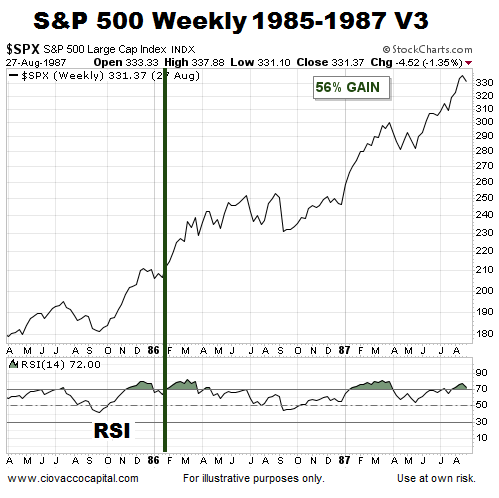
Strong Trend Blows Through RSI 70
An “overbought” market can remain overbought for some time before bad things happen. In early 1987, a push above 70 on weekly RSI signaled a strong market that was ready to rally for an additional eight months, telling us that weekly RSI can be difficult to use as a timing tool.
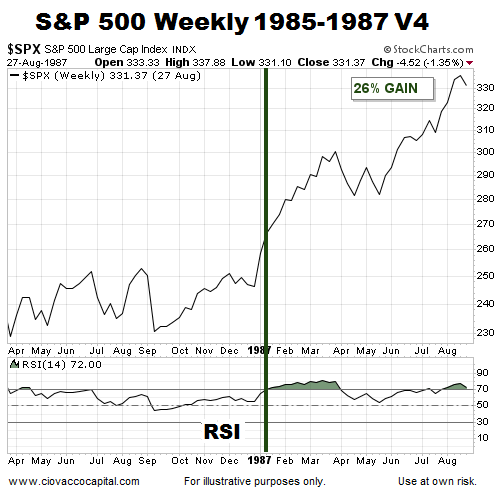
Waiting For A Pullback
When bullish conviction outpaces bearish conviction, waiting for an “overbought” market to pull back can be a frustrating experience. In 1991, as weekly RSI hung around the 69-to-70 range, stocks consolidated, but never pulled back in a significant manner before eventually posting additional gains of 30%.
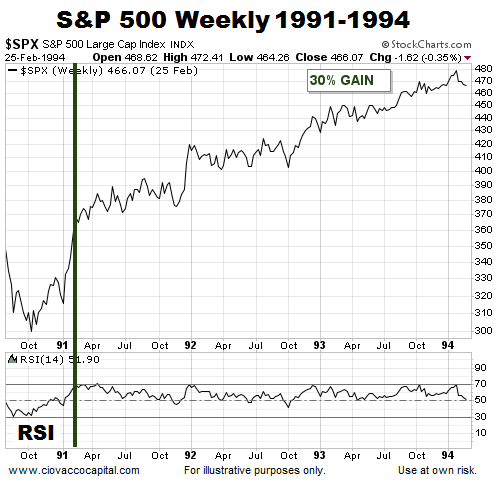
A Pause, Rather Than A Correction
Weekly RSI readings in the high 60s were not followed by a prolonged correction in late 1992.
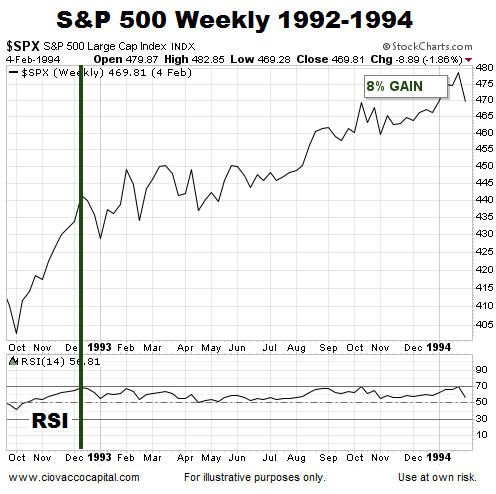
RSI 70 Can Be A Positive After Consolidation
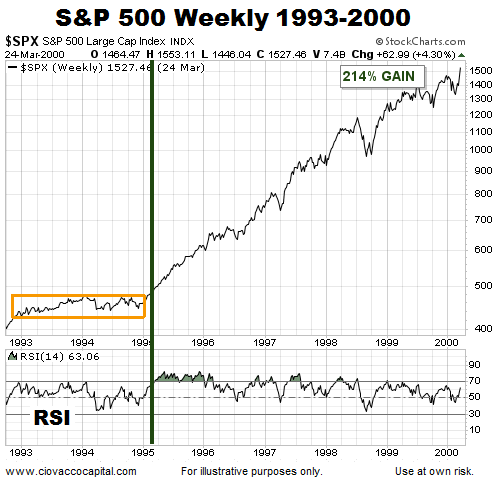
After stocks remained in a trading range in 1993-1994, rather than raising warning flags, a weekly RSI reading above 70 helped usher in a new and sustained trend following the breakout from the orange box below. The 1993-1995 case is also covered in this week’s video below. Regardless of what happens in 2017, if an “overbought” RSI reading can be followed by a 214% gain, it is easy to understand why it is difficult to classify it as a showstopper for stocks.
What Can We Learn From Similar Periods In History?
This week’s video looks at three historical periods that shared similar set-ups to February 2017, allowing us to gain some insight into how stocks may perform between now and December 31, 2017.
Consolidation, A Breakout, And A New Bullish Trend
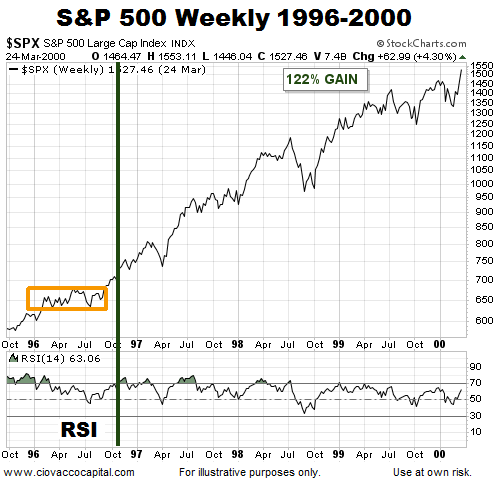
Calendar year 1996 also experienced a breakout from a consolidation box, a weekly RSI reading above 70, and significant and lasting gains in the S&P 500.
Another Breakout In 1997
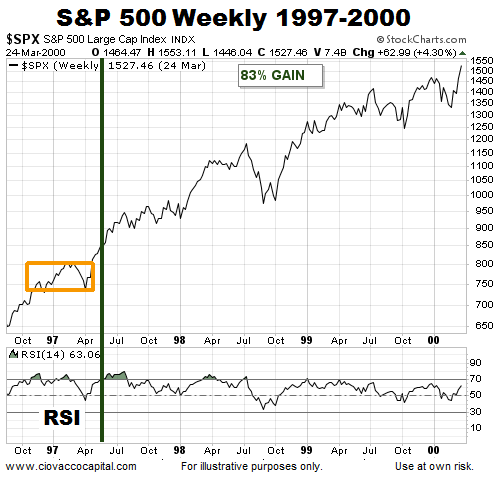
Weekly RSI readings did not spell doom for the bullish breakout that occurred in the spring of 1997; instead, the S&P 500 rallied an additional 83%.
Stocks Rise Following RSI Readings In High 60s
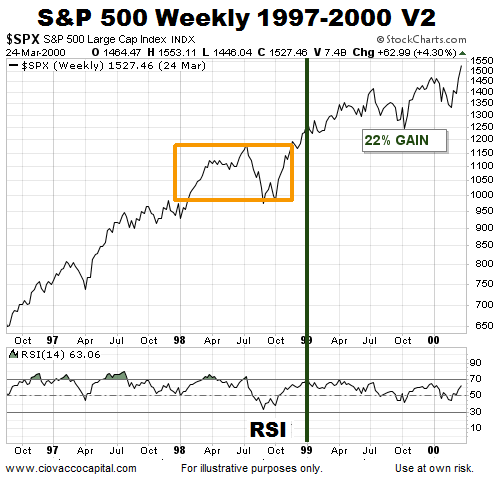
Weekly RSI could not crack the 70 threshold in 1999, telling us bullish trends were starting to wane. However, even as the trend was losing some steam, the S&P was able to push higher into calendar year 2000.
High RSI Following A Breakout
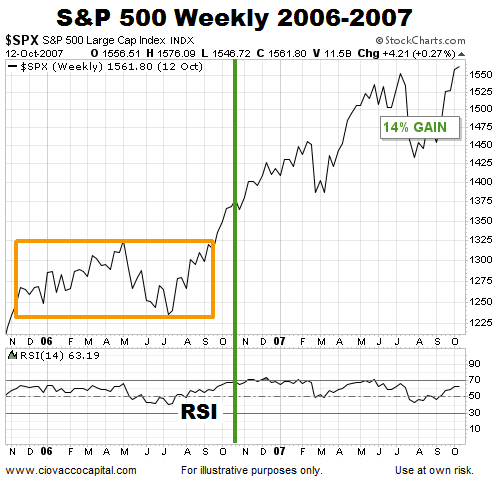
2006 represents another example of consolidation, a bullish breakout, weekly RSI readings near the 69-to-70 range, and a stock market that pushed higher.
One Purpose
In February 2017, weekly RSI is once again in “overbought” territory. The charts above were presented for one purpose and one purpose only:
Is it in the realm of historical possibility for overbought markets to remain overbought for long periods of time while posting impressive gains and avoiding significant pullbacks?
