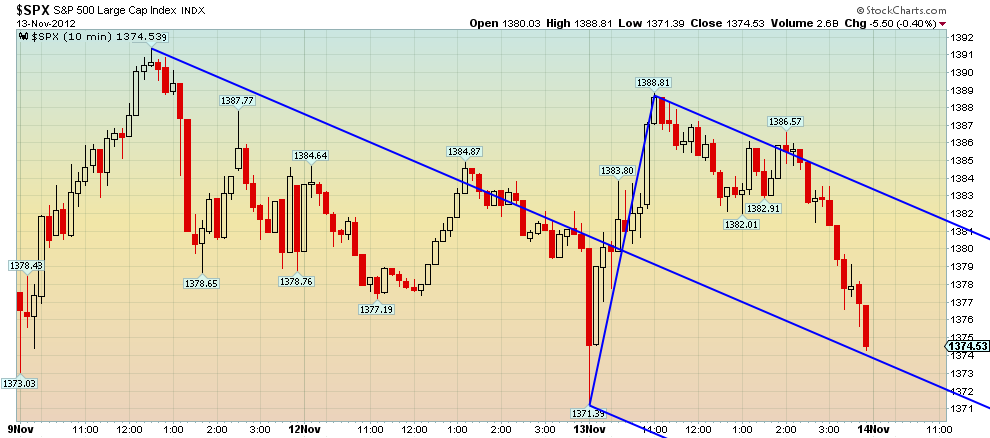
The S&P 500 managed yesterday to climb 17points from its low at 1371 towards 1388. As mentioned yesterday, prices needed to have broken the 1390 resistance for the market to continue rising.
The market however got rejected at the first important resistance we noted and pulled back sharply and closed at 1374.
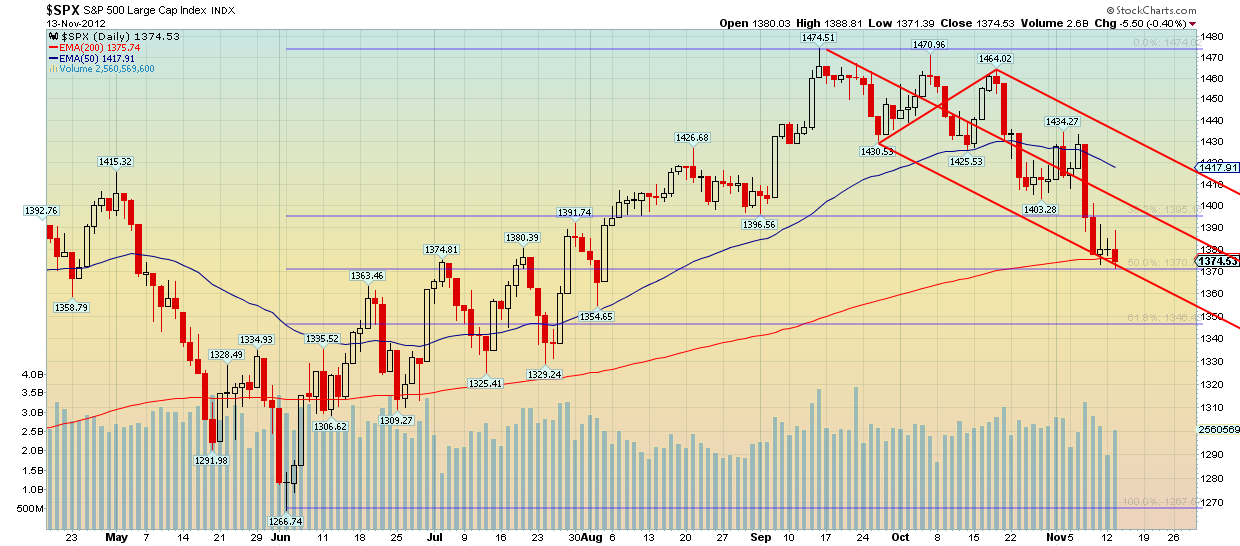
On the daily chart we see prices crawling on top of the lower pitchfork support and right on the 200 EMA. Prices should bounce from here towards 1400 where the middle pitchfork resistance lies. From the Elliott wave perspective in the daily chart we see 5 complete waves from 1370. Prices are paused at the 50% retracement. This could very well be wave C, This will be confirmed if prices start to rise impulsively and break above 1430 (wave A low: wave count as A-B-C)
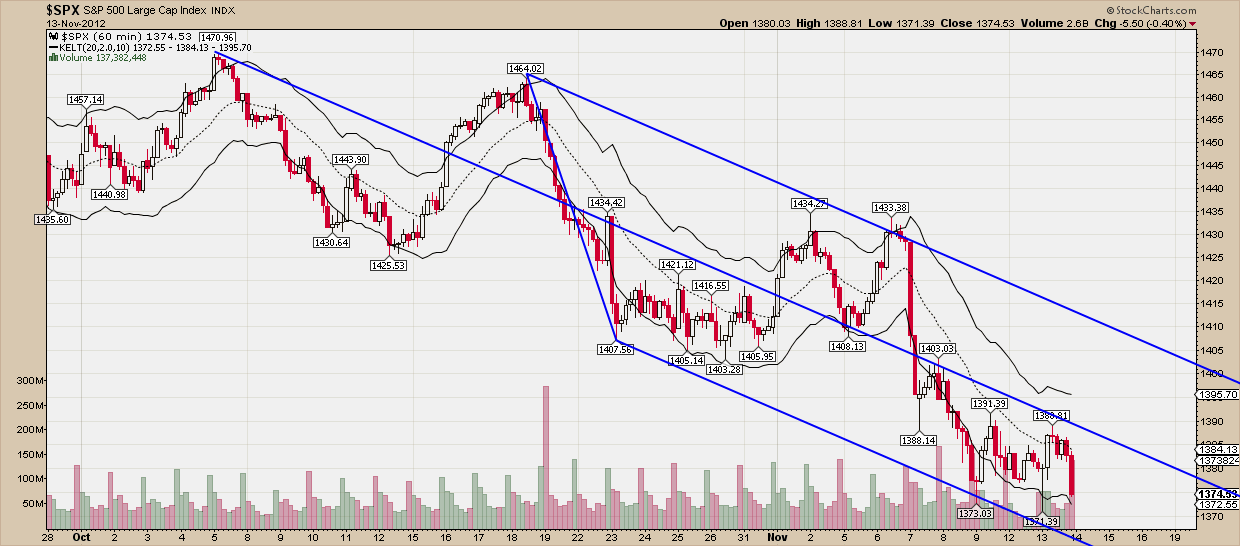
On the hourly chart, prices move sideways in the lower pitchfork support. The upward thrust at yesterdays session that pushed prices to 1388, was rejected at our resistance and with no clear impulsive pattern. This upward move could very well be just another upward correction before downtrend resumes. It is clearer at the 10 minute chart that the upward move is more like a 3 wave pattern than a 5 wave move. Weakness to break above 1390 confirms that the upward move is corrective. Prices below 1370 could accelerate the decline towards 1360. As mentioned in previous posts in the last few weeks, 1300 is the important support level. If the decline from 1474 is corrective, the minimum targets are achieved and no clear impulse is found. 
Our main objection regarding the decline from 1474 and whether it is an impulse, is found within the form of the decline from 1474 to 1430. It is in 3 waves and that is why I still count the whole decline as A-B-C. Time will tell if we are correct. Until we see some upward impulsive action, we will be very cautious with trading in the long side. If the market continues to move sideways and eventually breaks 1370, this event will make us wait for a bottom around 1350 where the 61,8% retracement is.
Always trade taking into consideration the support and resistance levels and don't trade with arrogance. Placing stops is the most important step in order to be successful. Never open a position without having considered your stop level. If you need help trading and using my charts, don't hesitate to contact me.
Disclosure: None of the information or opinions expressed in this blog constitutes a solicitation for the purchase or sale of any security or other instrument. Nothing in this article constitutes investment advice and any recommendations that may be contained herein have not been based upon a consideration of the investment objectives, financial situation or particular needs of any specific recipient. Any purchase or sale activity in any securities or other instrument should be based upon your own analysis and conclusions.
- English (UK)
- English (India)
- English (Canada)
- English (Australia)
- English (South Africa)
- English (Philippines)
- English (Nigeria)
- Deutsch
- Español (España)
- Español (México)
- Français
- Italiano
- Nederlands
- Português (Portugal)
- Polski
- Português (Brasil)
- Русский
- Türkçe
- العربية
- Ελληνικά
- Svenska
- Suomi
- עברית
- 日本語
- 한국어
- 简体中文
- 繁體中文
- Bahasa Indonesia
- Bahasa Melayu
- ไทย
- Tiếng Việt
- हिंदी
SPX Needs To Break Resistance Now Or It Will Fall Harder
Published 11/14/2012, 05:41 AM
Updated 07/09/2023, 06:31 AM
SPX Needs To Break Resistance Now Or It Will Fall Harder
3rd party Ad. Not an offer or recommendation by Investing.com. See disclosure here or
remove ads
.
Latest comments
SIR, very nice, keep it up, i am interested in reading all your articles. thank you.
thank you for your kind words, please feel free to visit my blog and become a follower. don't hesitate to comment and ask me anything you want regarding the markets.
Install Our App
Risk Disclosure: Trading in financial instruments and/or cryptocurrencies involves high risks including the risk of losing some, or all, of your investment amount, and may not be suitable for all investors. Prices of cryptocurrencies are extremely volatile and may be affected by external factors such as financial, regulatory or political events. Trading on margin increases the financial risks.
Before deciding to trade in financial instrument or cryptocurrencies you should be fully informed of the risks and costs associated with trading the financial markets, carefully consider your investment objectives, level of experience, and risk appetite, and seek professional advice where needed.
Fusion Media would like to remind you that the data contained in this website is not necessarily real-time nor accurate. The data and prices on the website are not necessarily provided by any market or exchange, but may be provided by market makers, and so prices may not be accurate and may differ from the actual price at any given market, meaning prices are indicative and not appropriate for trading purposes. Fusion Media and any provider of the data contained in this website will not accept liability for any loss or damage as a result of your trading, or your reliance on the information contained within this website.
It is prohibited to use, store, reproduce, display, modify, transmit or distribute the data contained in this website without the explicit prior written permission of Fusion Media and/or the data provider. All intellectual property rights are reserved by the providers and/or the exchange providing the data contained in this website.
Fusion Media may be compensated by the advertisers that appear on the website, based on your interaction with the advertisements or advertisers.
© 2007-2024 - Fusion Media Limited. All Rights Reserved.
