Breaking News
Subscribe Now 0
Q3 Earnings Alert: These are the most overvalued right now See Overvalued Stocks

SPX, Gold, GDX Technicals: 09_12_18

By Tim OrdETFsSep 12, 2018 12:04PM ET
www.investing.com/analysis/spx-gold-gdx-technicals-091218-200343504/
SPX, Gold, GDX Technicals: 09_12_18
By Tim Ord   |  Sep 12, 2018 12:04PM ET
Saved. See Saved Items.
This article has already been saved in your Saved Items
 
 
XAU/USD
+0.77%
Add to/Remove from Watchlist
Add to Watchlist
Add Position

Position added successfully to:

Please name your holdings portfolio
 
US500
+0.20%
Add to/Remove from Watchlist
Add to Watchlist
Add Position

Position added successfully to:

Please name your holdings portfolio
 
Gold
+0.72%
Add to/Remove from Watchlist
Add to Watchlist
Add Position

Position added successfully to:

Please name your holdings portfolio
 
GDX
-2.66%
Add to/Remove from Watchlist
Add to Watchlist
Add Position

Position added successfully to:

Please name your holdings portfolio
 
  • SPX Monitoring purposes; Monitoring purposes; Sold long SPX 9/7/18 at 2871.68=loss 1.03%: long 2901.52 on 8/31/18.
  • Monitoring purposes Gold: Long VanEck Vectors Gold Miners (NYSE:GDX) at 18.72 on 8/17/18
  • Long-term Trend SPX monitor purposes; Sold long-term SPX 7/16/18 at 2798.43= gain 2.95%; Long 6/29/18 at 2718.37.
  • Put/Call Ratio
    Put/Call Ratio

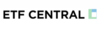
    The bottom window is the Index Put/Call ratio (CPCI). When this ratio hits the upper Bollinger® band the market at least bounces. There are three times the market bounced after CPCI hit the upper Bollinger band then retraced back down and those times where are March, May and July. Market can bounce here but probably will not go far and most likely will at least tests the recent lows again. Could end up with a sell signal if market does bounce. Ask for 30 day trial. Follow us on twitter. @OrdOracle.

    TICK:TRIN Ratio
    TICK:TRIN Ratio

    The top window is the McClellan oscillator and readings1.50 and the 3 MA of the Tick/TRIN ratio

    Gold Miners
    Gold Miners

    We updated this chart from yesterday. The bottom window is the 18 MA of the Advance/Decline and above that the 18 MA of the Up Down Volume and both indicators broke to new recent highs and made higher lows as GDX was making lower lows. We went back to all majors lows in GDX going back to the January 2016 low and found that they all showed major bullish divergences like we are having now. I might point out that a more ideal signal for a long position is when the Advance/Decline and Up Down volume indicators both close above “0” and that has not happen here, at least not yet. The COT commercial report for gold published last Friday, showed that gold commercials are not now net long 6525 contracts; the last time the commercials where net long came back at the 2001 gold bottom. Long GDX at 18.72 on 8/17/18. New Book release "The Secret Science of Price and Volume" by Timothy Ord.

SPX, Gold, GDX Technicals: 09_12_18
 

Related Articles

SPX, Gold, GDX Technicals: 09_12_18

Add a Comment

Comment Guidelines

We encourage you to use comments to engage with other users, share your perspective and ask questions of authors and each other. However, in order to maintain the high level of discourse we’ve all come to value and expect, please keep the following criteria in mind:  

  •            Enrich the conversation, don’t trash it.

  •           Stay focused and on track. Only post material that’s relevant to the topic being discussed. 

  •           Be respectful. Even negative opinions can be framed positively and diplomatically. Avoid profanity, slander or personal attacks directed at an author or another user. Racism, sexism and other forms of discrimination will not be tolerated.

  • Use standard writing style. Include punctuation and upper and lower cases. Comments that are written in all caps and contain excessive use of symbols will be removed.
  • NOTE: Spam and/or promotional messages and comments containing links will be removed. Phone numbers, email addresses, links to personal or business websites, Skype/Telegram/WhatsApp etc. addresses (including links to groups) will also be removed; self-promotional material or business-related solicitations or PR (ie, contact me for signals/advice etc.), and/or any other comment that contains personal contact specifcs or advertising will be removed as well. In addition, any of the above-mentioned violations may result in suspension of your account.
  • Doxxing. We do not allow any sharing of private or personal contact or other information about any individual or organization. This will result in immediate suspension of the commentor and his or her account.
  • Don’t monopolize the conversation. We appreciate passion and conviction, but we also strongly believe in giving everyone a chance to air their point of view. Therefore, in addition to civil interaction, we expect commenters to offer their opinions succinctly and thoughtfully, but not so repeatedly that others are annoyed or offended. If we receive complaints about individuals who take over a thread or forum, we reserve the right to ban them from the site, without recourse.
  • Only English comments will be allowed.
  • Any comment you publish, together with your investing.com profile, will be public on investing.com and may be indexed and available through third party search engines, such as Google.

Perpetrators of spam or abuse will be deleted from the site and prohibited from future registration at Investing.com’s discretion.

Write your thoughts here
 
Are you sure you want to delete this chart?
 
Post
Post also to:
 
Replace the attached chart with a new chart ?
1000
Your ability to comment is currently suspended due to negative user reports. Your status will be reviewed by our moderators.
Please wait a minute before you try to comment again.
Thanks for your comment. Please note that all comments are pending until approved by our moderators. It may therefore take some time before it appears on our website.
Comments (1)
Clint Allen
Clint Allen Sep 12, 2018 12:32PM ET
Saved. See Saved Items.
This comment has already been saved in your Saved Items
just started reading "The Secret Science of Price and Volume.
 
Are you sure you want to delete this chart?
 
Post
 
Replace the attached chart with a new chart ?
1000
Your ability to comment is currently suspended due to negative user reports. Your status will be reviewed by our moderators.
Please wait a minute before you try to comment again.
Add Chart to Comment
Confirm Block

Are you sure you want to block %USER_NAME%?

By doing so, you and %USER_NAME% will not be able to see any of each other's Investing.com's posts.

%USER_NAME% was successfully added to your Block List

Since you’ve just unblocked this person, you must wait 48 hours before renewing the block.

Report this comment

I feel that this comment is:

Comment flagged

Thank You!

Your report has been sent to our moderators for review
Continue with Apple
Continue with Google
or
Sign up with Email