- SPX Monitoring purposes; Long SPX on 10/22/18 at 2755.88.
- Monitoring purposes Gold: sold 11/27/18 at 18.88=gain .075%; Long VanEck Vectors Gold Miners (NYSE:GDX) at 18.72 on 8/17/18
- Long-Term Trend SPX monitor purposes; Long SPX on 10-19-18 at 2767.78
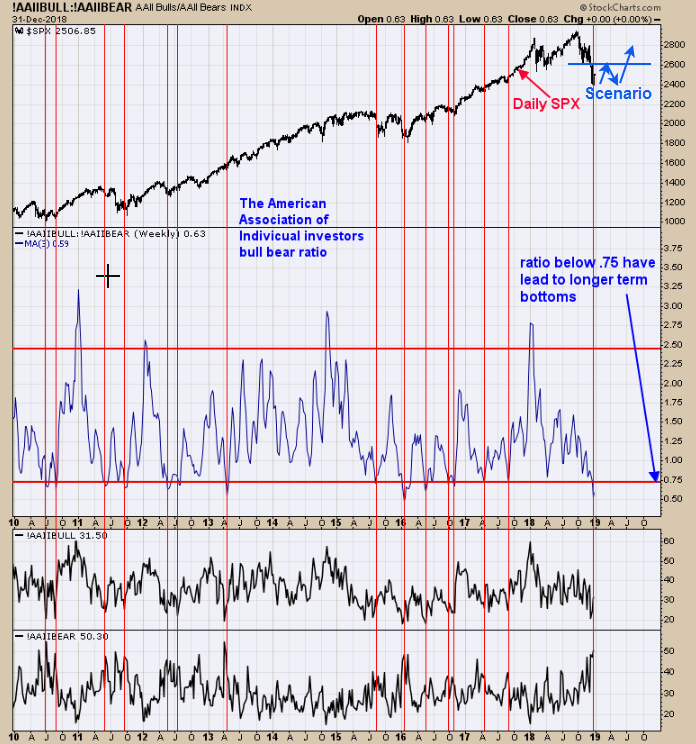
Seasonality is bullish into Thursday (Santa Claus rally). The above chart is “The American Association of Individual Investors bull Bear ratio”. The chart above goes back 9 years and shows the Times when the three period moving average of this ratio falls below .75 (current reading is .59). This ratio suggests an intermediate term low is forming here. At some point the December 24 low (2350 SPX) may be tested, but first a retracement of 50% of the down move may come first which is near the 2630 SPX range. We have been long from the 2750 range and may sell if and when we get to 2630 range and possibly enter a short position for a test of the low. The first half of 2019 could see lots volatility. Have a happy New Year. Follow us on twitter. @OrdOracle
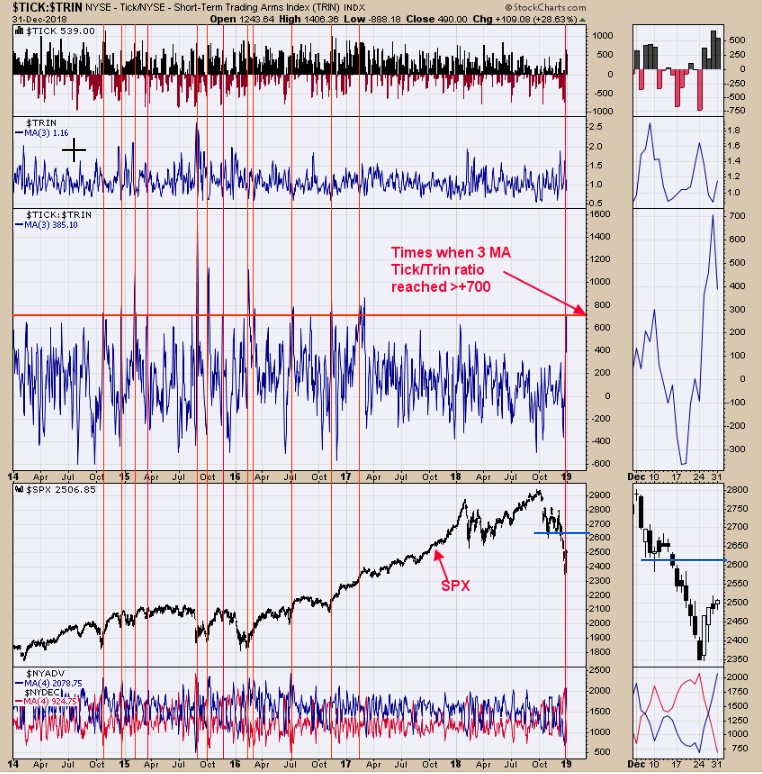
The middle window is the “3 day average of the Tick/Trin ratio”. This chart goes back five years and shows the times when this ratio reached >700. In most cases when the Tick/Trin ratio reached +700 was the beginning of a strong rally and especially so after a significant decline (like we have now). To get the Tick/Trin ratio >700, one would need +700 tick close with a Trin close near 1.00 three days in a row. Or a +350 tick close with a TRIN of 2.00 three days in a row or a combination of both. In general the Trin would need to be above 1.50 and the ticks above +500 to get these +700 readings and we have had that. Will the market continue to its 50% retracement level of 2630 range or will it pull back to make a double bottom first before heading higher? Hopefully that will be answered with more evidence comes in. Either way the market appears heading intermediate term higher. Follow us on twitter. @OrdOracle
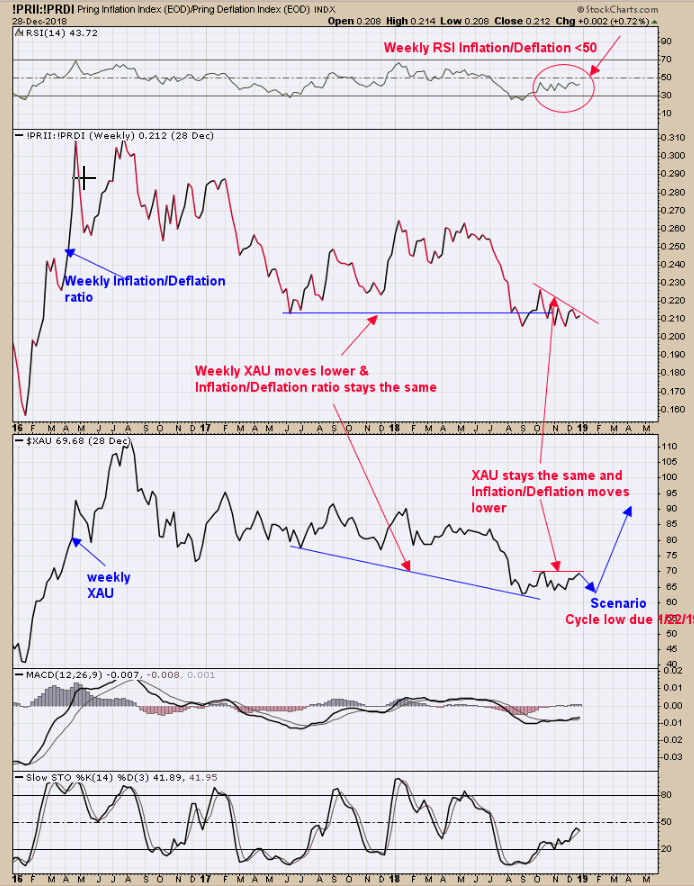
The top window is the weekly RSI for the Inflation/Deflation ratio. When the RSI >50 a bullish up move is underway and below 50 a bearish move is in progress and the current reading is 43.72. The inflation/Deflation ratio normally marches in step to XAU and when there is a difference between the two, the ratio usually has the correct move. The weekly XAU moved down into a September low breaking below the 2017 low; however, the Inflation/Deflation ratio matched in its 2017 low and has have been holding steady since, giving a longer term bullish sign. Looking over the shorter term since the October high, the XAU matched it October high and Inflation/Deflation ratio made a much lower higher suggesting short term weakness. A possible pull back may materialize short term for the XAU (GDX). The next intermediate up-move may begin early 2019. Idea time for a gold and gold stock bottom is January 22, 2019. Not sure if the pull back will test the September low but it could. We will wait for the next bullish setup. New Book release "The Secret Science of Price and Volume" by Timothy Ord.


