Get 40% Off
👀 👁 🧿 All eyes on Biogen, up +4,56% after posting earnings. Our AI picked it in March 2024.
Which stocks will surge next?
Unlock AI-picked Stocks

SPX And The Top Formation

Published 05/02/2014, 12:46 AM
Updated 07/09/2023, 06:31 AM

I am writing this post after reading Michael Harris’ article “A Top Formation in S&P 500 Index”. Michael has touched a subject of rigid, straightforward interpretations of consolidation patterns leading to mistaken conclusions of possible outcomes. I couldn’t agree with him more. The human brain is hardwired to look for and find repetitive patterns even in an environment where they don’t exist. Rather than trying to fit the chaotic price movement of a loose consolidation into one of the preconceived patterns let’s look at the ongoing consolidation in the S&P 500 within a broader price action context.

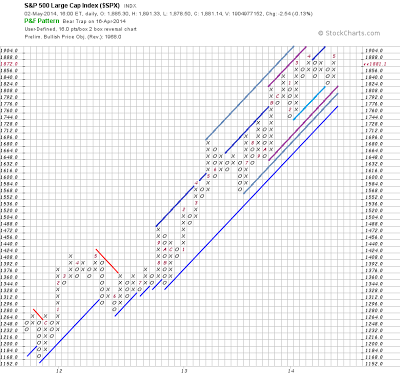
SPX Daily Chart

Here is the 2 box reversal P&F SPX chart with a box size equals the ATR (250). The 16 point box size filters daily average (over the last year) noise. Objective trendlines give a good visualization of the trend. We see that since the beginning in the second half of 2012 the current uptrend accelerated two times breaking out of the blue channel and forming two new channels - grey and purple. The upper trendline of the purple channel lies within the grey channel and indicates that the second acceleration was less powerful than the one which had formed the grey channel. However, this fact can hardly prove the trend reversal claim. The price isn’t even close to the lower trendlines. Moreover, it has not violated the interim bullish support line (light blue) yet. A consolidation within an uptrend is considered to be bullish first. Only when the price starts breaking down through the support lines, a possibility of reversal will come into play. Until then let the price dictate trades, not a preconceived opinion.
3rd party Ad. Not an offer or recommendation by Investing.com. See disclosure here or remove ads .
 
Disclaimer: I express only my personal opinion on the market and do not provide any trading or financial advice (see Disclaimer on my site).

Latest comments

Risk Disclosure: Trading in financial instruments and/or cryptocurrencies involves high risks including the risk of losing some, or all, of your investment amount, and may not be suitable for all investors. Prices of cryptocurrencies are extremely volatile and may be affected by external factors such as financial, regulatory or political events. Trading on margin increases the financial risks.
Before deciding to trade in financial instrument or cryptocurrencies you should be fully informed of the risks and costs associated with trading the financial markets, carefully consider your investment objectives, level of experience, and risk appetite, and seek professional advice where needed.
Fusion Media would like to remind you that the data contained in this website is not necessarily real-time nor accurate. The data and prices on the website are not necessarily provided by any market or exchange, but may be provided by market makers, and so prices may not be accurate and may differ from the actual price at any given market, meaning prices are indicative and not appropriate for trading purposes. Fusion Media and any provider of the data contained in this website will not accept liability for any loss or damage as a result of your trading, or your reliance on the information contained within this website.
It is prohibited to use, store, reproduce, display, modify, transmit or distribute the data contained in this website without the explicit prior written permission of Fusion Media and/or the data provider. All intellectual property rights are reserved by the providers and/or the exchange providing the data contained in this website.
Fusion Media may be compensated by the advertisers that appear on the website, based on your interaction with the advertisements or advertisers.
© 2007-2024 - Fusion Media Limited. All Rights Reserved.