
Covered call writing and put-selling candidates must pass a series of fundamental, technical and common-sense screens in order to be considered eligible for our portfolios. In early January 2017, one of our members, Jim W, asked about using Ford Motor Corp. (NYSE:F), a stock that does not pass our BCI screens but has several positive features:
- Analyst recommendations (I don’t put much weight into this one)
- Improving chart technicals (okay you have my attention now)
- News of an impending 1-time special cash dividend during the first quarter, 2017
Improving chart technicals

Ford Chart: 1/5/2017
A 1-year chart clearly demonstrates an encouraging price pattern. There was a bullish moving average crossover (red arrow) in December and bullish signals coming from the MACD histogram, stochastic oscillator with volume confirmation (green circles). Now, of note are the major whipsaws present in this chart indicating a stock that may offer high premium due to the inherent implied volatility (IV) displayed in this chart pattern. To confirm, we simply can look at our option premiums but as an additional exercise I went to a free site: www.ivolatility.com to check the IV of F compared to the overall market:

Implied Volatility of Ford Stock in January,2017
Sure enough, we see the IV of Ford is triple (27.13%) that of the S&P 500 (9.13%) and therefore we would expect significant returns for near-the-money strikes despite being a blue-chip company. Let’s see if we can generate at least a 2% initial return using this underlying. Turning to the 1-month options chain, our expectations are confirmed:

Ford: 1-Month Options Chain
With Ford trading at $12.90, the near-the-money $13.00 call generated a 2.3%, 1-month return ($0.30/$12.90) and a 3.1% total return if Ford moves up to the $13.00 strike price buy expiration.
Special 1-time cash dividend
In January 2017, Ford did announce an additional dividend to be distributed in March, 2017:
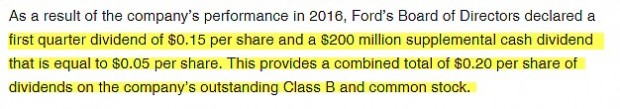
Certainly, a company that has additional cash to distribute to its shareholders represents an asset when deciding if the stock is a viable candidate.
What happened since early January?
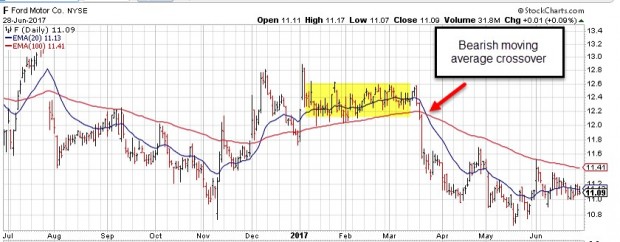
Ford: Bearish Moving Average Crossover
For the next 2 months Ford price shows a consolidating chart pattern (moving sideways as shown in the yellow field) until mid-March when there was a bearish moving average crossover (red arrow) when our bullish assessment would have been revisited.
Discussion
Generally, we should remain structured to our system of self-investing. If we were to veer slightly and make exceptions from time-to-time, we would look to a stock that has improved technically and shows fundamental strength as did Ford in the form of a special 1-time cash dividend. Such candidates would also have to generate the premiums that meet our goals.
Market tone
Global stocks declined slightly this week partially due to central bank discussions of scaling back monetary stimulus. Oil prices rebounded, rising to $45.40 from $42.65 last Friday. Volatility, as measured by the Chicago Board Options Exchange Volatility Index, ticked up to 11.18 from 10.6. This week’s economic and international news of importance:
- Markets turned volatile this week after a series of hawkish comments from central bankers suggesting that the era of ultra-loose monetary policy may be nearing its end
- European Central Bank president Mario Draghi’s speech last Tuesday to a gathering of central bankers in Portugal suggested that the ECB is considering curbing its asset-buying program
- Bank of England governor Mark Carney said the Monetary Policy Committee will debate a rate move in the next few months
- US Federal Reserve chair Janet Yellen voiced concerns that equity and other asset valuations are on the rich side, which suggests that financial stability worries could keep the Fed on a tightening path, despite easing US inflation pressures
- Inflation pressures remain as the eurozone reported on Friday that consumer prices rose only 1.3% in June versus a year ago, down from 1.4% in May. That’s well below the ECB’s near-2% target
- US economic growth in the 1st quarter was revised higher for a second time on Thursday. Gross domestic product expanded at a 1.4% annual rate, the US Bureau of Economic Analysis reported
- The eurozone economic sentiment indicator (ESI) jumped to a nearly 10-year high of 111.1 in June from 109.2 in May. The ESI reached 111.8 in August 2007, just before the global financial crisis began to intensify
- A stolen police helicopter strafed and dropped grenades on Venezuela’s Supreme Court and Interior Ministry headquarters this week as protests against President Nicolas Maduro intensified. The political tumult comes against the backdrop of a deepening economic crisis fueled by runaway inflation, food shortages and falling government revenues stemming from weak oil prices
THE WEEK AHEAD
Mon, July 3rd
- Eurozone Manufacturing PMI, unemployment report
- United States Markit Manufacturing PMI
- US ISM report
Tue, July 4th
- US Independence Day
Wed, July 5th
- Eurozone Retail sales, Markit services PMI
- United States FOMC minutes
Thu, July 6th
- Eurozone ECB minutes
Fri, July 7th
- United Kingdom Industrial production
- US June employment report
For the week, the S&P 500 moved lower by 0.61% for a year-to-date return of 8.24%.
Summary
IBD: Uptrend under pressure
GMI: 3/6- Buy signal since market close of April 21, 2017
BCI: I am fully invested in the stock portion of my portfolio currently holding an equal number of in-the-money and out-of-the-money strikes. I’m keeping an eye on the recent increase in volatility in the tech sector and so I remain cautious with 50% in-the-money strikes.
WHAT THE BROAD MARKET INDICATORS (S&P 500 AND VIX) ARE TELLING US
The 6-month charts point to a neutral to slightly bullish outlook. In the past six months, the S&P 500 was up 8% while the VIX (11.18) moved down by 20%.