Get 40% Off
🚨 Volatile Markets? Find Hidden Gems for Serious OutperformanceFind Stocks Now

S&P Repeating 2000 And 2007 Patterns Almost Exactly?

Published 04/06/2020, 07:29 AM
Updated 07/09/2023, 06:31 AM

SPX Chart

Does History Repeat? Is does rhyme sometimes!

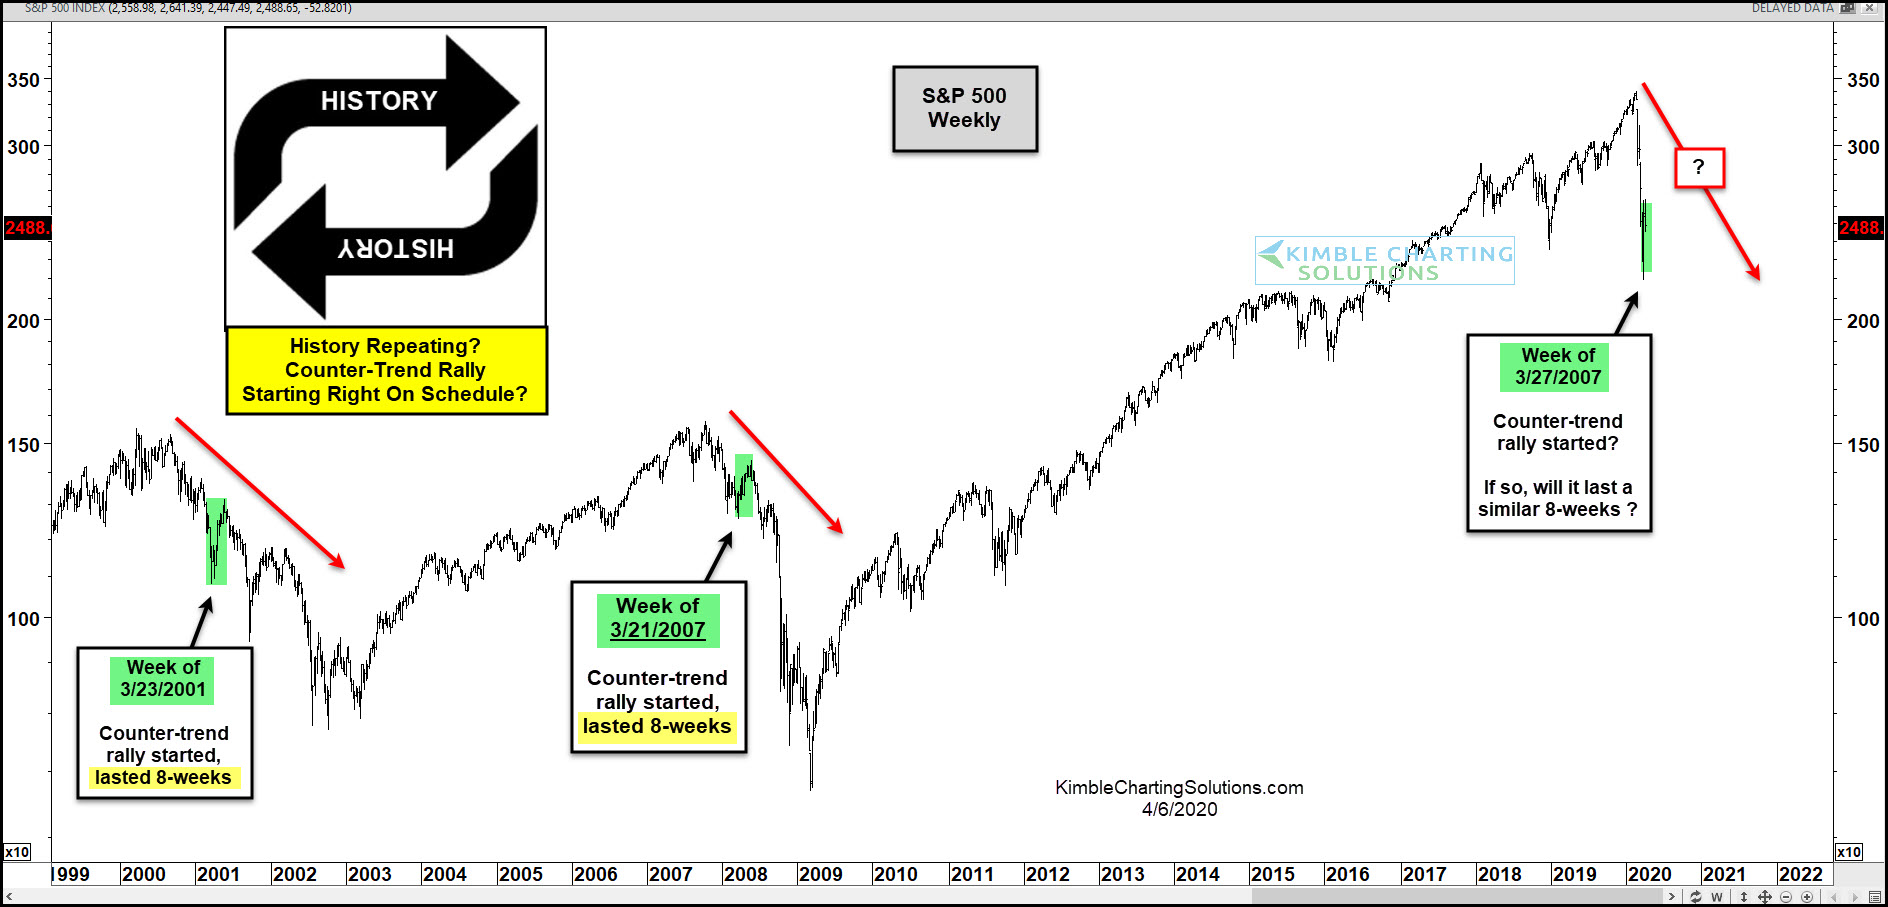
This chart looks at the S&P 500 on a weekly basis over the past 20-years.

The S&P declined by 50% during the 2000-2003 bear market. On the week of 3/23/2001, it experienced its first counter-trend rally, which lasted 8-weeks, before the bear market resumed.

The S&P declined by 50% during the 2007-2009 bear market. On the week of 3/21/2001, it experienced its first counter-trend rally, which lasted 8-weeks, before the bear market resumed.

Last month the S&P hit a low during the week of March 27, 2020. Is a counter-trend rally starting right on schedule? If so, will it last 8-weeks again?

Both counter-trend rallies hit the same Fibonacci retracement level, before rolling over and resuming bear markets.

The odds are low the pattern repeats exactly. The impact would be big if it does.

We shared this pattern on 3/20/20, reflecting that a counter-trend rally was due to start the following week. I humbly feel it is to all of our benefits to be aware of this pattern and what to watch for in a very detailed degree, to see if the bigger pattern is repeating the bear markets of the past.

Latest comments

no, it will climb new highs this year. trump will win.
thanks for the great article, I will be ready to exit after the counter rally, cheers
It is sad but it is true...
I did not think,shown CHART is a weekly chart.
Chart date seems to be off
Risk Disclosure: Trading in financial instruments and/or cryptocurrencies involves high risks including the risk of losing some, or all, of your investment amount, and may not be suitable for all investors. Prices of cryptocurrencies are extremely volatile and may be affected by external factors such as financial, regulatory or political events. Trading on margin increases the financial risks.
Before deciding to trade in financial instrument or cryptocurrencies you should be fully informed of the risks and costs associated with trading the financial markets, carefully consider your investment objectives, level of experience, and risk appetite, and seek professional advice where needed.
Fusion Media would like to remind you that the data contained in this website is not necessarily real-time nor accurate. The data and prices on the website are not necessarily provided by any market or exchange, but may be provided by market makers, and so prices may not be accurate and may differ from the actual price at any given market, meaning prices are indicative and not appropriate for trading purposes. Fusion Media and any provider of the data contained in this website will not accept liability for any loss or damage as a result of your trading, or your reliance on the information contained within this website.
It is prohibited to use, store, reproduce, display, modify, transmit or distribute the data contained in this website without the explicit prior written permission of Fusion Media and/or the data provider. All intellectual property rights are reserved by the providers and/or the exchange providing the data contained in this website.
Fusion Media may be compensated by the advertisers that appear on the website, based on your interaction with the advertisements or advertisers.
© 2007-2024 - Fusion Media Limited. All Rights Reserved.