Get 40% Off
🚨 Volatile Markets? Find Hidden Gems for Serious Outperformance
Find Stocks Now

S&P 500 Forward Earnings Curve: Improvements in Rate of Decline Continue

Published 05/08/2020, 03:47 PM

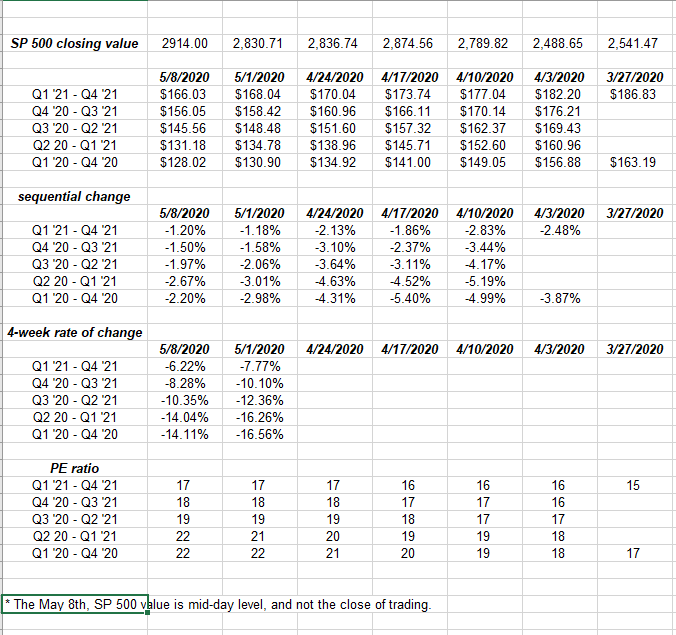
Using some interim IBES data by Refinitiv reports, here is the “forward earnings curve” for the S&P 500. This Week in Earnings comes out tonight.

As readers can see using the base case the 2020 S&P (NYSE:SPY) 500 estimate, the sequential improvements continue in the rate of decline of the forward estimates, which should give investors some comfort that S&P 500 earnings are not as bleak as the mainstream media might lead you to believe.

The worst year-over-year growth rates continue to indicate that Q2 2020 will be the nadir for S&P 500 EPS y/y growth.

There continues to be some skepticism that 2021 S&P 500 EPS will remain above the $162.39 2019 actual EPS.

Dr. David Kelly of JP Morgan thinks that the 2021 S&P 500 EPS will fall below the 2019 actual print, as does the DataTrek Reserach bloggers, Nick Colas and Jessica Rabe, who estimate 2021 EPS at:

“#1: Q1 US corporate earnings are down 14% in Q1. Q2 should be the trough at -37%, but 2H recovery is more U-shaped by the day. Best case for 2021: $147/share, 19x for the S&P 500.”

Stimulus, Stimulus, Stimulus (is helping):

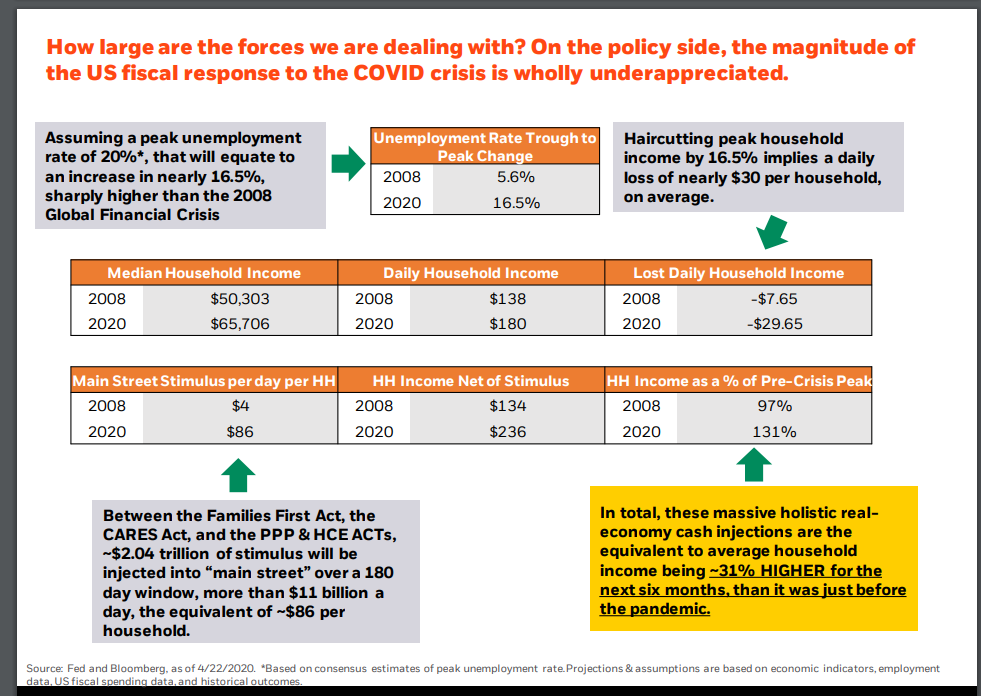
Possibly the best slide of BlackRock’s Rick Rieder presentation to clients on Thursday, May 7, 2020.

What this slide details is the amount of income lost in both the 2008 Financial Crisis and the 2020 pandemic (today).

The yellow box in the far right-hand corner shows that – with the fiscal stimulus – the average household income could be 31% higher for the next six months versus prior to the pandemic.

3rd party Ad. Not an offer or recommendation by Investing.com. See disclosure here or remove ads .

From an anecdotal standpoint, I have two friends – one a pilates trainer at a well-known health club in the Chicago suburbs, and the other a waitress (both women) who are out of work with the sheltering-in-place and lockdown in Illinois, and both of whom aren’t really in any hurry to get back to work. While we don’t get into specifics, neither seems financially stressed in the least bit, and can continue on unemployment for a while longer.

The goal of the stimulus is to replace the drop in household income with government support so “consumption” doesn’t drop precipitously, and that seems to be working.

The stimulus is different from the Fed liquidity, which can be discussed at another time.

Conclusion: CNBC’s Joe Kernan interviewed Dr. Jeremy Seigal, the famed Wharton B-school professor, this morning after the release of the April ’20 nonfarm payroll report, and during the discussion, Dr. Siegal said something I had never heard before: most market participants think of the “stock market” as a leading economic indicator, looking 6-9 months out into the future and discounting that future into current prices. Dr. Siegal said that the stock market looks at 18 months forward earnings and discounts that future earnings stream today, although Dr. Siegal didn’t reference any study or academic finding as to where he derived that conclusion.

That was the first time I had ever heard of the “18-month horizon.”

That would mean that today’s market is looking at 2022 S&P 500 EPS, which today is being forecast at $187.46 and is currently expecting 13% y/y growth relative to the 2021 S&P 500 estimate.

3rd party Ad. Not an offer or recommendation by Investing.com. See disclosure here or remove ads .

Here is a table of the forward, expected growth rates, for 2020, 2021, 2022:

The “average” S&P 500 EPS growth rate today for 2020 and 2021 is currently at 4%, as was shown last week here.

This is the third week in a row the “average” for 2020 and 2021 expected S&P 500 EPS has averaged 4%, another indication that forward earnings might be in the early stages of stabilizing.

All the base data that this blog uses is from IBES data by Refinitiv, from David Aurelio and his staff. They do good work, but this blog takes the data and has tried to find other working patterns that might aid in spotlighting turns in S&P 500 EPS.

To be honest, in late 2018, I was caught completely off-guard by the rapid drop in S&P 500 earnings that occurred throughout 2019 (2019’s expected S&P 500 earnings growth fell from an expected 7% in January ’19 down to 1% by December ’19), which was highlighted by the Q4 ’18 23% drop in the S&P 500. That wasn’t good (in terms of the analysis).

In that case, unlike Jeremy Seigal’s 18-month forecast horizon, the S&P 500 EPS estimate actually began to decline in growth in January ’19 from 7% to 3% by the end of March ’19.

In this practical case, the S&P 500 was looking 3-6 months out, but the blow was cushioned when Fed Chair Jerome Powell started to loosen monetary policy.

Examining the rate-of-change for the forward estimates is a big help. Bob Doll of Nuveen and LizAnn Sonders of Schwab were early in late September, 2018, turning more bearish, and noting a change in the rate of decline in S&P 500 estimates.

3rd party Ad. Not an offer or recommendation by Investing.com. See disclosure here or remove ads .

Latest comments

Whenever a stimulus package is approved, the equity market will fall mich further... More and more misleading information... Not sure who is paying for these articles?
the simply ? to ask is - are you or any of your friends in a hurry to go to rests, the mall, fly, take a cruise or holiday to somewhere with packed parks/beachs - the answer for most people is no - all the phony baloney about everything returning to normal in the next month to 6 months is pie in the sky thinking - yes some people are going to return to work but i would venture that 50% of those currently unemployed won't be - yes fuel consumption will increase but not by enough to justify drilling more holes - inventory is sky high and we had a global over supply - also remember the Opec + deal is for 2 months that just isn't going to overcome the change in demand!
I guess whoever wrote this article trying to justify his check. misleading article
The rate of reduction isn't all that bad , really? Anyone with common sense can see that by opening our economy without temporary regulation will feed this pandemic to the max. Trump's impediment will never allow him to see this. Hang on because he's taking us for a ride we'll never forget
Based on EPS values, considering 2019 as the guide, it is possible to estimate the S&P pick is at 3080 region if, only if, a 25% drop is expected for 2020 earnings. However, it is liky to be less than just a Q drop. On the other hand, a 10% correction, bringing S&P back to 2700 region would relief the PE ration to the average past ratios.
Sure if youre factoring q1 where we were open for 2/3 months at an unemployment rate of 3.5% but then you take q2 with lets face it at minimum 17% bit probably closer to 40% due to furlough with benefits. And then contracted gdp by 40%+ 2700 would be a highly over priced s&p.
dont know the authors motivation, but it is obvious that there is a lot of interest to keep the public believing this is over in a hurry without any structural damage. but a sheer look at the numbers of countries out of the lockdown shows that this is far from what is to be expected.
Agree with Daniel - this author is smoking something.....The stimulus for Yoga instructors will not go forever.
This is a load of Horse .. your friends the waitress and the yoga instructor LOL they arent getting their jobs back even if they wanted them. There are many many Americans suffering and many many people unable to pay for basic necessities already and or piling on debt with pushed off mortgage and rent payments. coupled that with the fact that you cant stay on unemployment forever, banks are lowering credit limits or closing credit accounts. and there's a 0 percent chance everyone gets there jobs back. the devaluing of our currency by just printing it to hand out to pay bills that are evaluated at pre covid values. will only cause hyperinflation. and a diminished jobs market. It might make sense as to why things aren't collapsing as of yet. but please do price in the future that is so certain in your models. literally all you did was explain why we haven't crashed yet.
Risk Disclosure: Trading in financial instruments and/or cryptocurrencies involves high risks including the risk of losing some, or all, of your investment amount, and may not be suitable for all investors. Prices of cryptocurrencies are extremely volatile and may be affected by external factors such as financial, regulatory or political events. Trading on margin increases the financial risks.
Before deciding to trade in financial instrument or cryptocurrencies you should be fully informed of the risks and costs associated with trading the financial markets, carefully consider your investment objectives, level of experience, and risk appetite, and seek professional advice where needed.
Fusion Media would like to remind you that the data contained in this website is not necessarily real-time nor accurate. The data and prices on the website are not necessarily provided by any market or exchange, but may be provided by market makers, and so prices may not be accurate and may differ from the actual price at any given market, meaning prices are indicative and not appropriate for trading purposes. Fusion Media and any provider of the data contained in this website will not accept liability for any loss or damage as a result of your trading, or your reliance on the information contained within this website.
It is prohibited to use, store, reproduce, display, modify, transmit or distribute the data contained in this website without the explicit prior written permission of Fusion Media and/or the data provider. All intellectual property rights are reserved by the providers and/or the exchange providing the data contained in this website.
Fusion Media may be compensated by the advertisers that appear on the website, based on your interaction with the advertisements or advertisers.
© 2007-2024 - Fusion Media Limited. All Rights Reserved.