
The stock market began the year on a very weak note, but currently, it appears to be just a correction of December’s advances. The S&P 500 index may also be entering a consolidation after a significant uptrend that started in November from the 4,100 level. Last week, I closed my medium-term long position on the S&P 500 contract. However, I think that the medium-term uptrend is not reversing at the moment.
On Friday, the S&P 500 index gained 0.18% after a volatile trading day, following a better-than-expected monthly jobs data announcement. Earlier, the market dipped below its Thursday’s local low, marking the lowest point since December 13 - the day that marked a pivot in the Fed’s monetary policy.
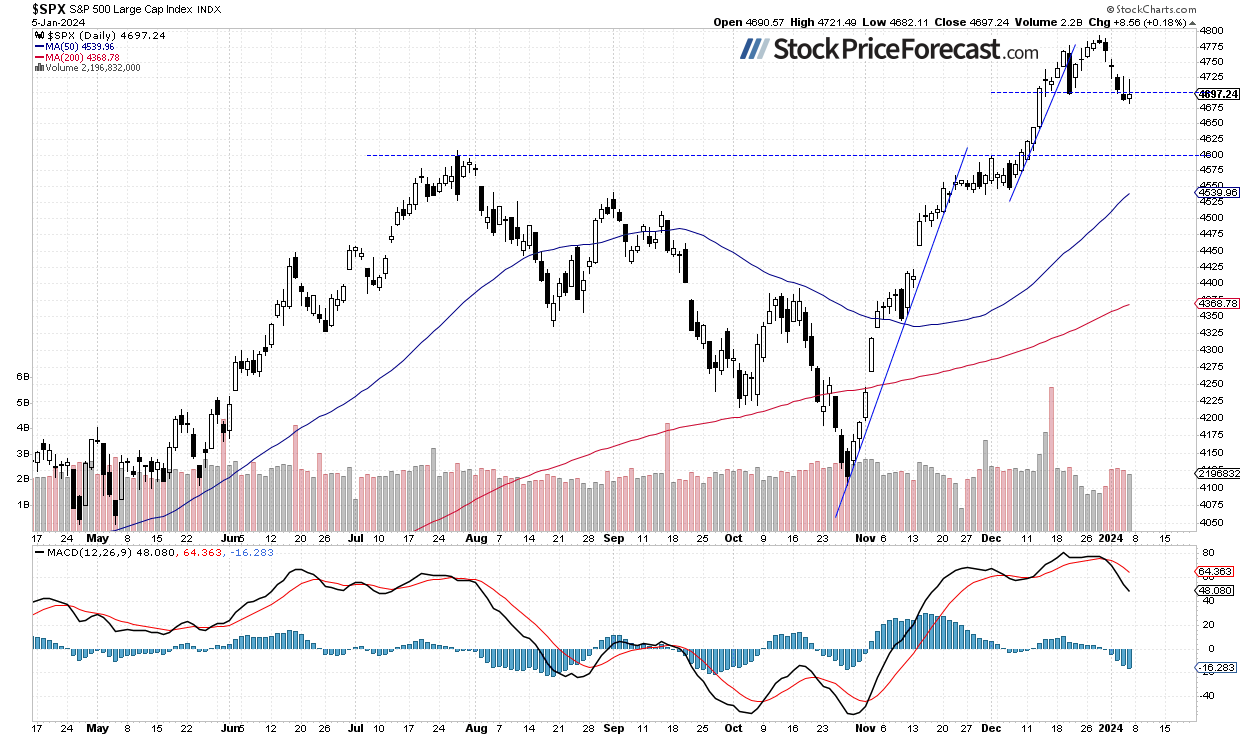
In early December, the S&P 500 broke above the late July local high of around 4,607, resuming a rally from the medium-term local low of 4,103.78 on October 27. Last week, investors were taking profits off the table following the previous week’s rally. The index bounced off the 4,800 level and the resistance marked by January 4, 2022, all-time high of 4,818.62.
Investor sentiment remains bullish; Last Wednesday’s AAII Investor Sentiment Survey showed that 48.6% of individual investors remain bullish, surprisingly higher than the previous reading of 46.3%. The AAII sentiment is a contrary indicator in the sense that highly bullish readings may suggest excessive complacency and a lack of fear in the market. Conversely, bearish readings are favorable for market upturns.
This morning, stocks are likely to open virtually flat, with the S&P 500 futures contract trading 0.1% above its Friday’s closing price. The market may see attempts at rebounding from the 4,700 level. Investors will be waiting for the important Consumer Price Index release on Thursday.
As mentioned on December 21, “the likely scenario is a consolidation along 4,700-4800”, and, despite last week’s dip below 4,700, this prediction is still proving accurate. How can we capitalize on such trading action? It’s better to shorten the timeframe of the trades and look for buying opportunities at support levels and selling at resistance levels.
The index retraced more of its December rally on Friday, as we can see on the daily chart.
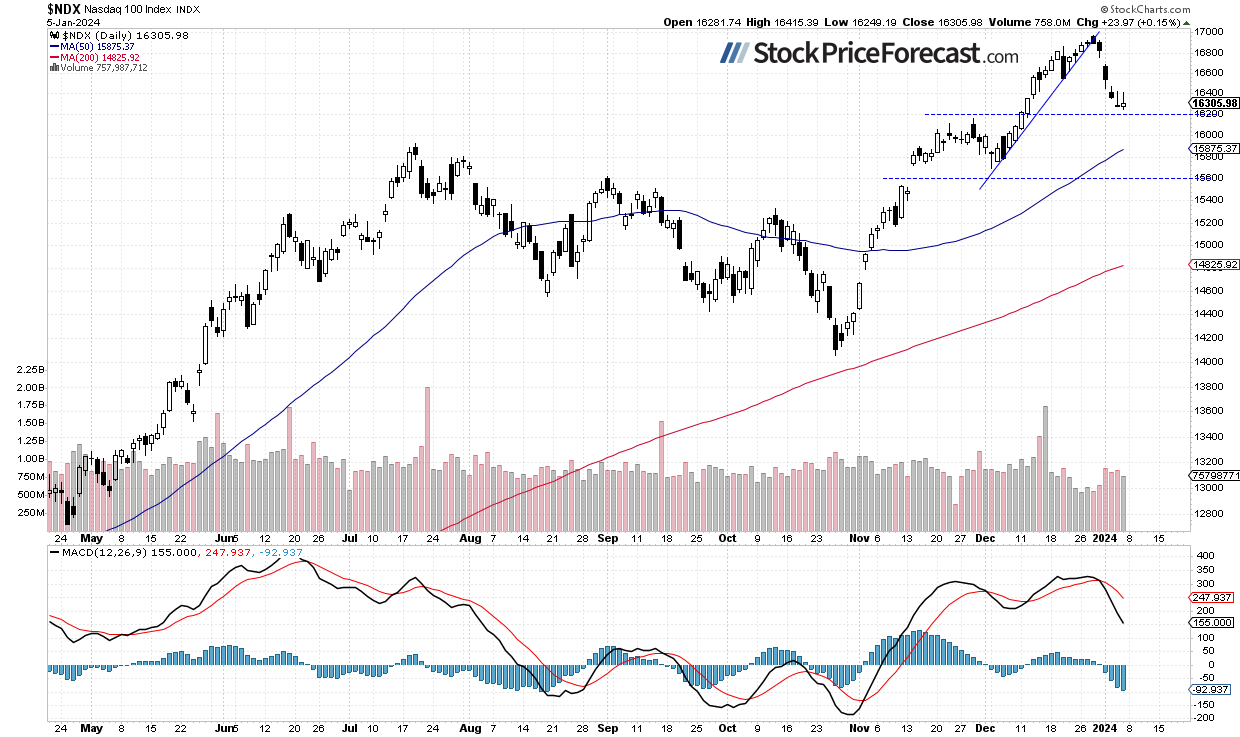
Nasdaq Went Sideways on Friday
Recently, the technology-focused Nasdaq 100 index was extending its uptrend, reaching a new all-time high of 16,969.17 on Thursday, December 28. On the previous Friday, I wrote, “While it continues to trade above its month-long uptrend line, there are, however, short-term overbought conditions that may lead to a downward correction at some point.”. Indeed, the market experienced a sharp sell-off last week. Although it still appears to be just a downward correction, caution is advised, as there are no confirmed buying signals at present.
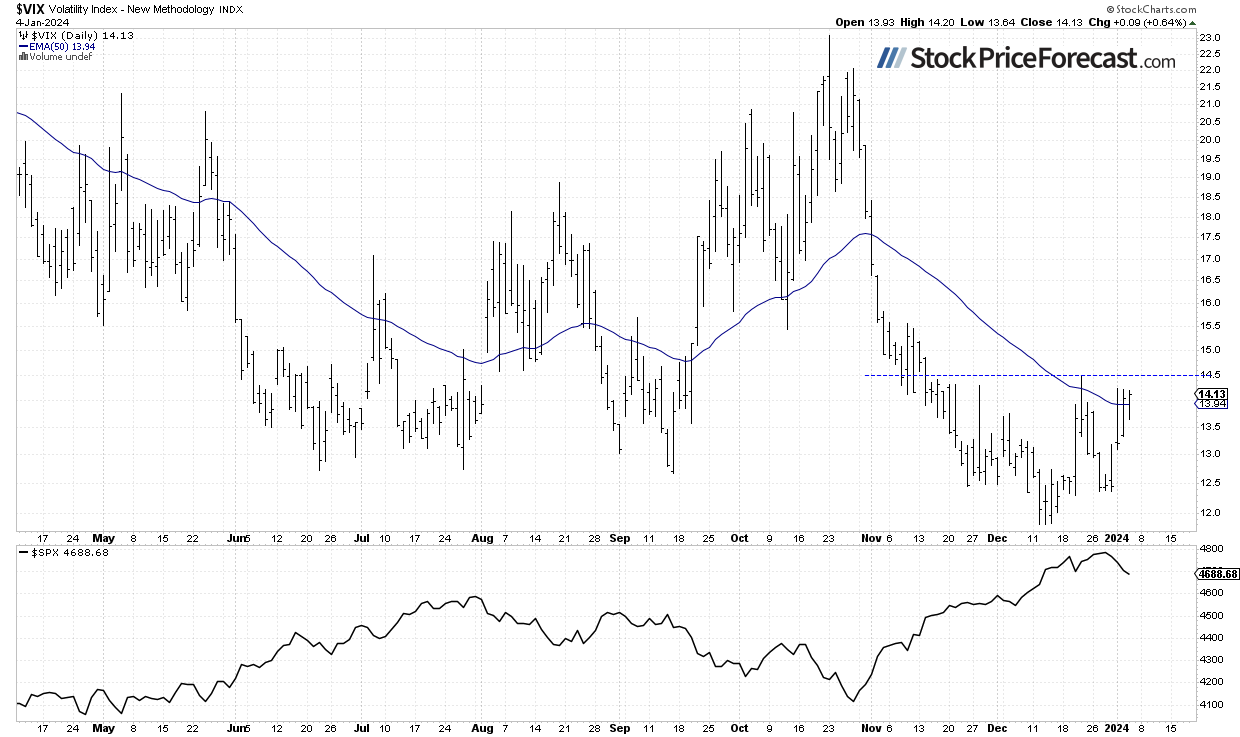
VIX – Sharp (OTC:SHCAY) Downturn
The VIX index, also known as the fear gauge, is derived from option prices. On Friday, it bounced down from the previous highs along 14.0-14.5 level, which is a positive signal. Historically, a dropping VIX indicates less fear in the market, and rising VIX accompanies stock market downturns.
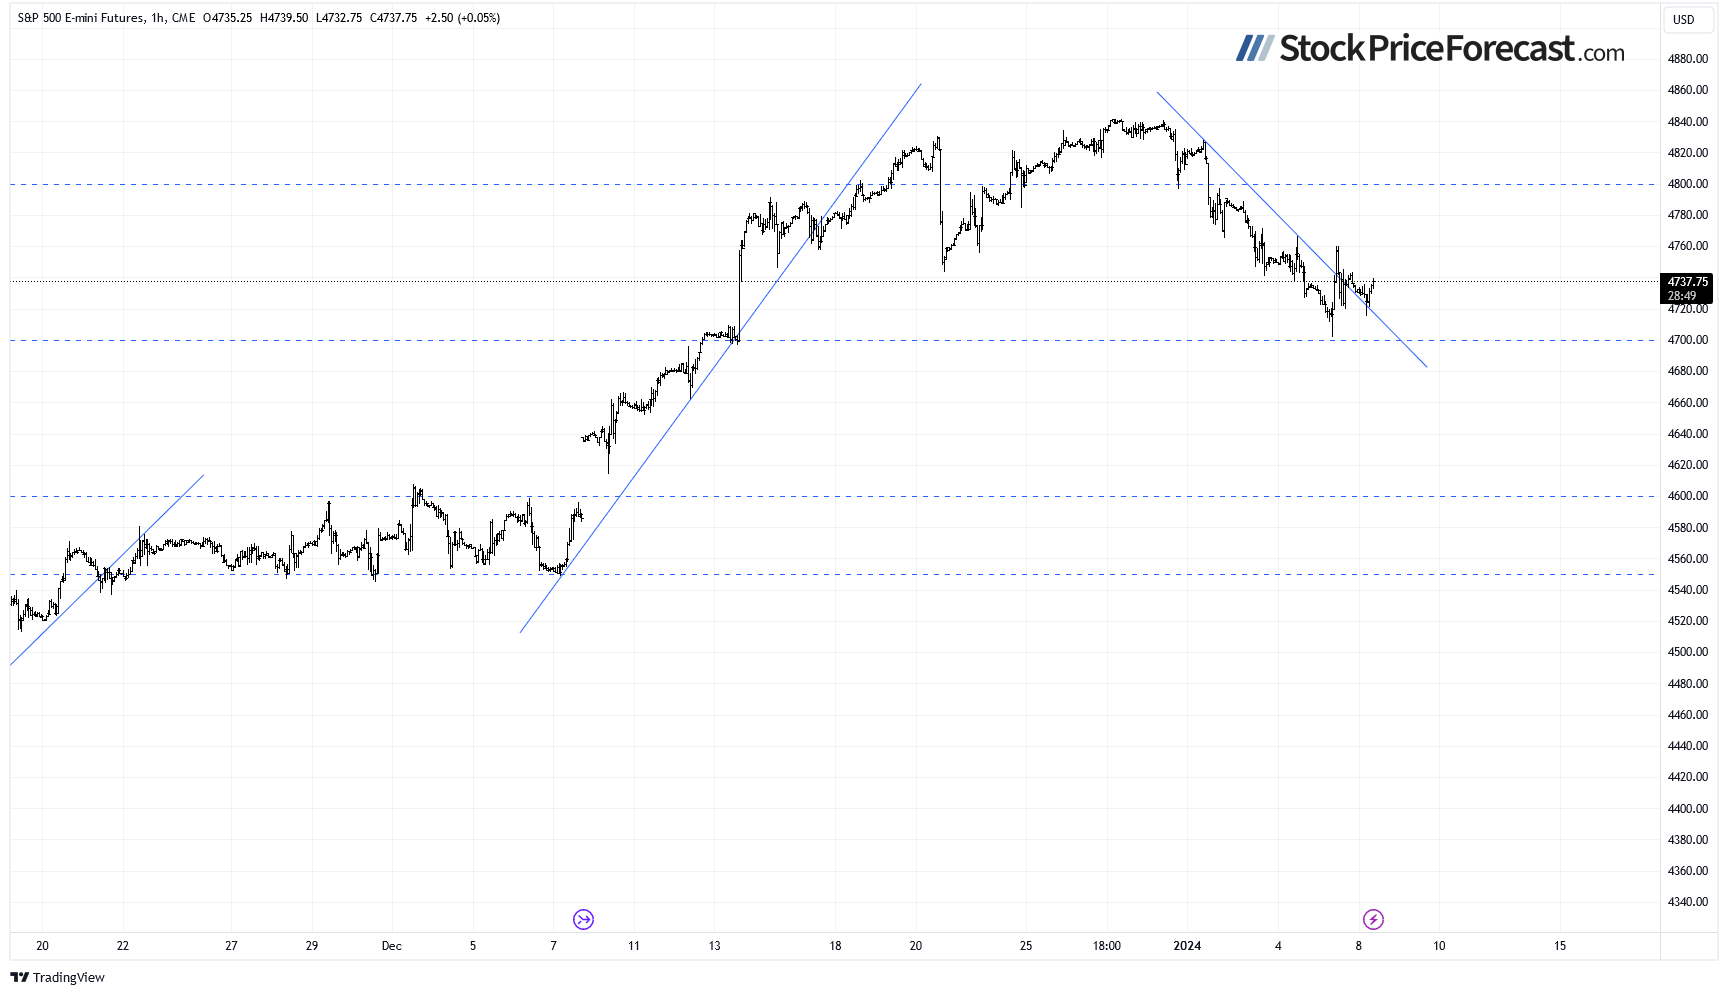
Futures Contract Bounced From 4,700
Let’s take a look at the hourly chart of the S&P 500 futures contract. This morning, it’s trading sideways, as it fluctuates following Friday’s intraday rebound. The support level remains at 4,700, and the resistance is at 4,760.
Conclusion
Stocks are expected to open virtually flat today, and the S&P 500 index will extend a short-term consolidation along the 4,700 level. The market may be forming a short-term bottom here, but it’s hard to say whether it will resume its medium-term uptrend or simply trade within a consolidation following the November-December rally.
On December 21, I mentioned that “in a short-term, the market may see some more uncertainty and volatility”, and indeed, there is a lot of uncertainty following an early-December rally and the breakout of the S&P 500 above the 4,700 level. There is still a chance of extending the medium-term uptrend, as no confirmed negative signals have emerged. However, the short-term market picture is currently more blurry, and indexes have begun their downward correction or the mentioned consolidation.
In light of the recent market’s volatility, technical overbought conditions, and the prevailing bullish sentiment, I decided to cash profits in from a long position at the opening of last Tuesday’s cash market’s trading session. Overall, it gained 752.8 index points from the opening level of 3,992.4 on Feb. 27.
In the near future, I will shift focus to a more short-term-oriented trading strategy. For now, my short-term outlook remains neutral and I think that no positions are justified from the risk/reward point of view.
Here’s the breakdown:
- The S&P 500 is likely to extend a consolidation along the 4,700 level this morning.
- In the near term, stocks may rebound, but currently, it appears more like a consolidation than the start of a new uptrend.
- Short-term uncertainty and volatility may favor trading based on support and resistance levels.
- In my opinion, the short-term outlook is neutral.