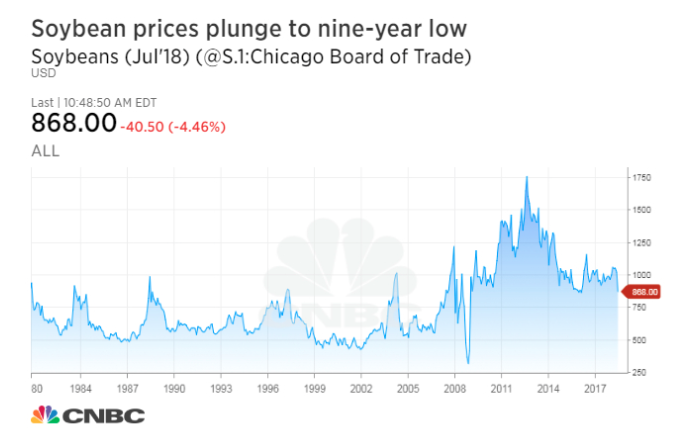
Early this week the price of Soybean futures (ZS_F) plunged to a new low in more than 9 years due to the tit-for-tat trade war between U.S. and China. Soybean Futures started to drop on Friday last week after Trump administration decided to go ahead with 25% tariff on $50 billion worth of goods from China. The list of targeted goods includes technology products which are part of Beijing’s Made in China 2025 initiative.
China quickly retaliated with its own 25% tariff on 545 U.S. goods worth equal value, including agricultural products such as soybeans, corn, and wheat. Soybean futures for July delivery dropped more than 7% to $8.415 a bushel, the lowest since March 2009. The price is now 10% down for the year, and more than 17% down for the quarter.
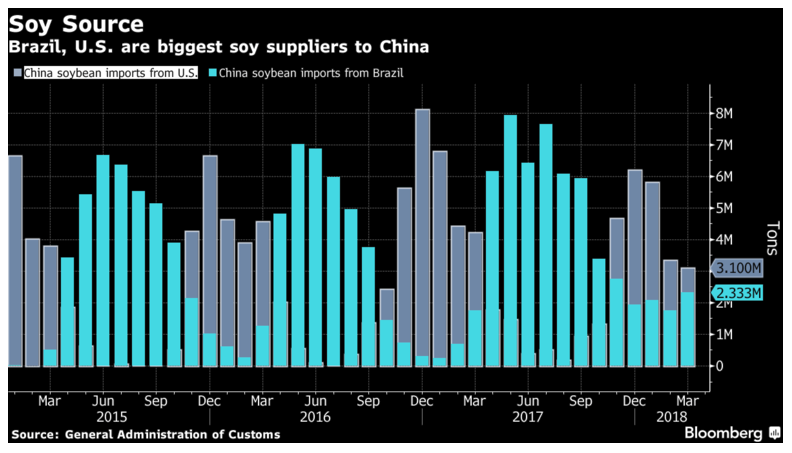
According to the study by Purdue University, if Beijing applies 10% tariff on U.S. Soybeans, total soybean exports could drop by 18%. China still buys more soybeans from the U.S. than any other agricultural commodity. Last year, China bought $14 billion worth of soybean. China is the world’s biggest importer of soybean and America’s largest buyer.
However, in the short term, as the world’s top importer, China can not fulfill its soybean needs without importing massive quantities of the U.S. product. China still needs U.S soybean in a few months, even next year. However, if the trade war drags on for a long time, China can look for an option which could have irreversible effects on U.S. markets.
So in the short term, China will feel the pain of having to purchase U.S. soybean at higher cost in the next couple of months. The higher price that the Chinese needs to pay is somewhat offset with the declining Soybean Futures price. U.S farmers on the other hand are also feeling the pain with soybean futures price near 10 year low. In the long run, depending on how long the conflict persists, the unintentional result will be that China can adapt without U.S soybean.
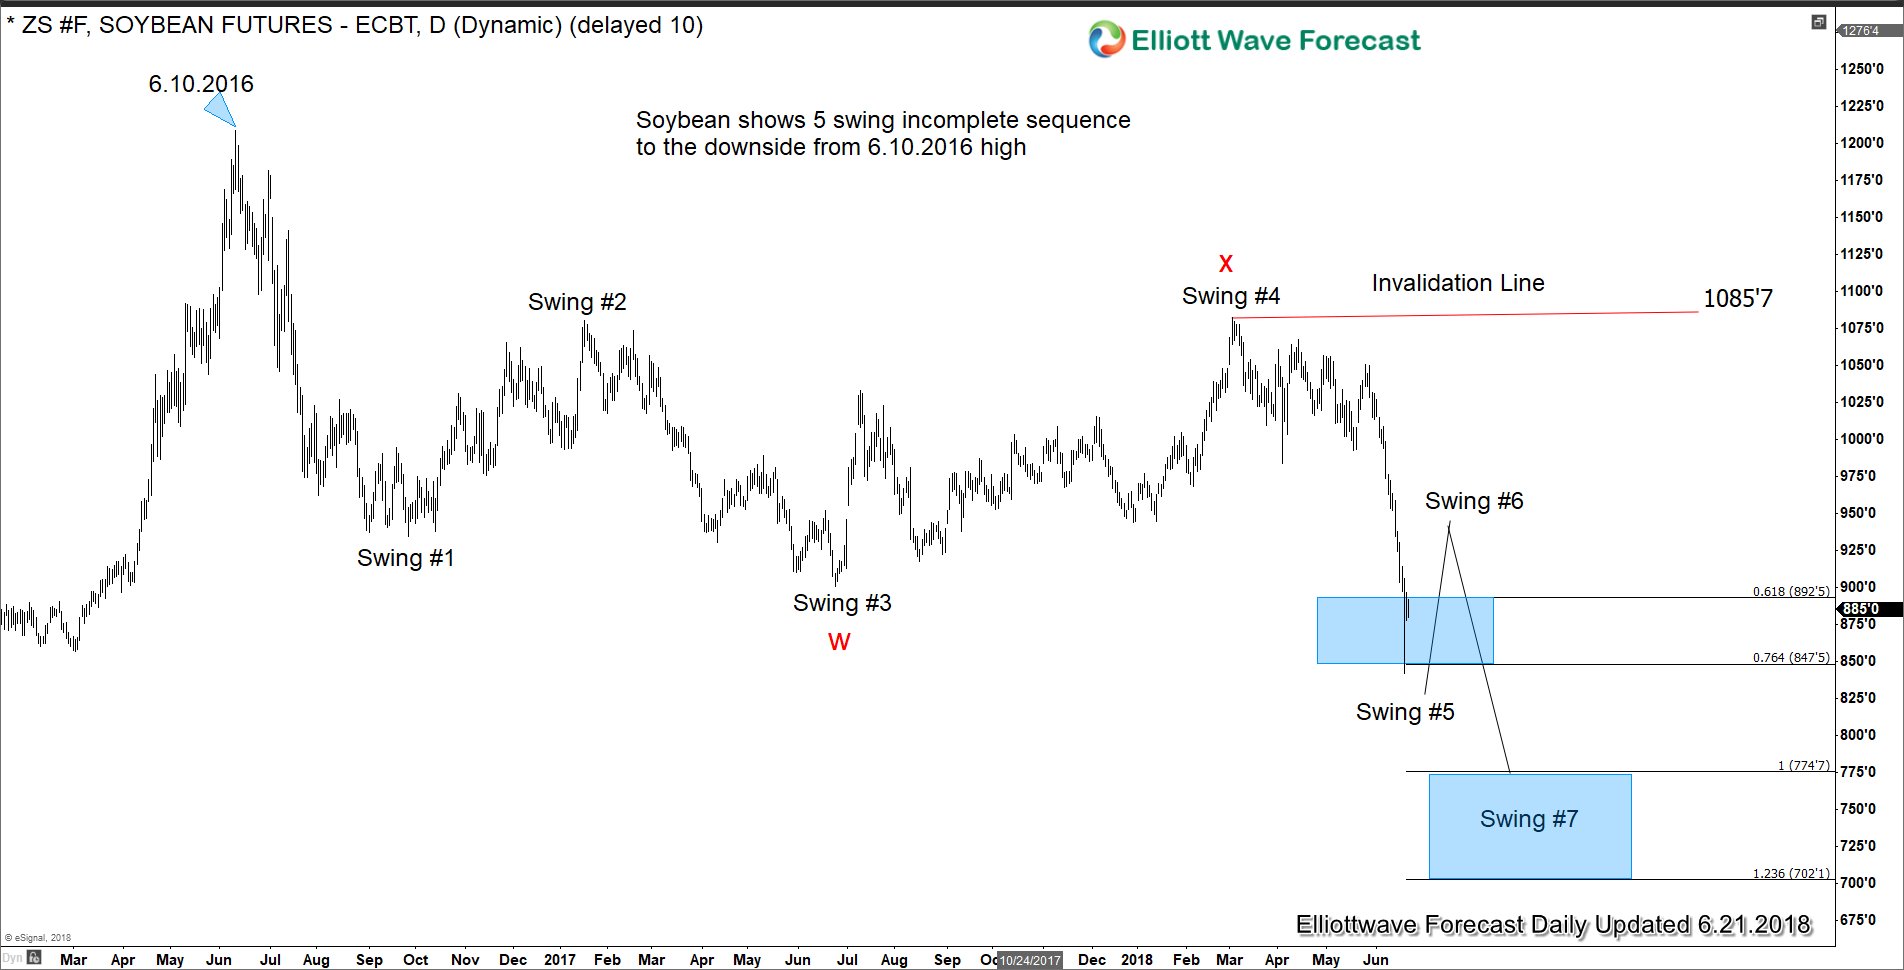
Soybean Daily Elliott Wave Analysis
Daily chart of Soybean Futures (ZS_F) shows a 5 swing incomplete sequence from 6.10.2016 high, favoring further downside. Please note that this 5 swing does not refer to well-known 5 waves impulse in Elliott Wave Theory. Rather, it’s part of a 7 swing structure, which is also known by the name of double three Elliott Wave structure (WXY). You can learn more about this special structure by watching the video “How to trade WXY Elliottwave Structure.” Soybean Futures is expected to bounce in swing #6 and as long as the rally fails below swing #4 (1085.7), then it’s expected to extend lower towards 702.1 – 774.7. So the price per bushel target is $7.02 – $7.75 approximately.
- English (UK)
- English (India)
- English (Canada)
- English (Australia)
- English (South Africa)
- English (Philippines)
- English (Nigeria)
- Deutsch
- Español (España)
- Español (México)
- Français
- Italiano
- Nederlands
- Português (Portugal)
- Polski
- Português (Brasil)
- Русский
- Türkçe
- العربية
- Ελληνικά
- Svenska
- Suomi
- עברית
- 日本語
- 한국어
- 简体中文
- 繁體中文
- Bahasa Indonesia
- Bahasa Melayu
- ไทย
- Tiếng Việt
- हिंदी
Soybean Hit 9 Year Low Due to Trade War
Published 06/22/2018, 10:26 AM
Updated 03/09/2019, 08:30 AM
Soybean Hit 9 Year Low Due to Trade War
3rd party Ad. Not an offer or recommendation by Investing.com. See disclosure here or
remove ads
.
Latest comments
Install Our App
Risk Disclosure: Trading in financial instruments and/or cryptocurrencies involves high risks including the risk of losing some, or all, of your investment amount, and may not be suitable for all investors. Prices of cryptocurrencies are extremely volatile and may be affected by external factors such as financial, regulatory or political events. Trading on margin increases the financial risks.
Before deciding to trade in financial instrument or cryptocurrencies you should be fully informed of the risks and costs associated with trading the financial markets, carefully consider your investment objectives, level of experience, and risk appetite, and seek professional advice where needed.
Fusion Media would like to remind you that the data contained in this website is not necessarily real-time nor accurate. The data and prices on the website are not necessarily provided by any market or exchange, but may be provided by market makers, and so prices may not be accurate and may differ from the actual price at any given market, meaning prices are indicative and not appropriate for trading purposes. Fusion Media and any provider of the data contained in this website will not accept liability for any loss or damage as a result of your trading, or your reliance on the information contained within this website.
It is prohibited to use, store, reproduce, display, modify, transmit or distribute the data contained in this website without the explicit prior written permission of Fusion Media and/or the data provider. All intellectual property rights are reserved by the providers and/or the exchange providing the data contained in this website.
Fusion Media may be compensated by the advertisers that appear on the website, based on your interaction with the advertisements or advertisers.
© 2007-2024 - Fusion Media Limited. All Rights Reserved.
