Nike stock plunges 10% on margin fears despite Q2 earnings beat

Recent data has been weaker than projections. Last week, auto sales dipped and the latest employment report was somewhat disappointing. This week retail sales, industrial production and housing starts numbers were off. Earlier this week, Bloomberg noted this development:
While President Donald Trump is looking for some "very good numbers" on U.S. growth shortly, the economic data of late have fallen short of economists' forecasts
The Bloomberg U.S. Economic Surprise Index, which measures whether incoming economic data beat or miss expectations of surveyed economists, fell below zero Thursday for the first time this year to the lowest point since just after last November's election. Economists, though, still project a pickup in second-quarter growth.
Since the election, sentiment indicators have been strong while actual data has been a bit weaker. It appears this split has infected economists as well; their projections have assumed some level of lower taxes, fiscal stimulus and regulatory relief that has not materialized. Markets have recently lowered their expectations. Perhaps economists should as well.
Although retail sales were down .3% M/M, they increased 3.8% Y/Y. And the following table from the report shows that this month’s weakness, while broad, was the exact opposite of the previous month:

The 3, 6 and 12 month moving average of the rolling Y/Y percentage change shows no weakness:

Finally, the following scatterplot shows the relationship between the Y/Y percentage change in real retail sales and payroll growth:

These two variables have a correlation of .68, indicating their movements have a fairly strong positive relationship. So long as job growth continues, we should see an increase in retail sales.
Industrial production – another key coincident indicator – was also disappointing; it was flat month/month. But the overall trend remains higher:

The overall index (blue line, left scale) is rising as is the percentage change from the previous year (red line, right scale). But the internals are a bit concerning:
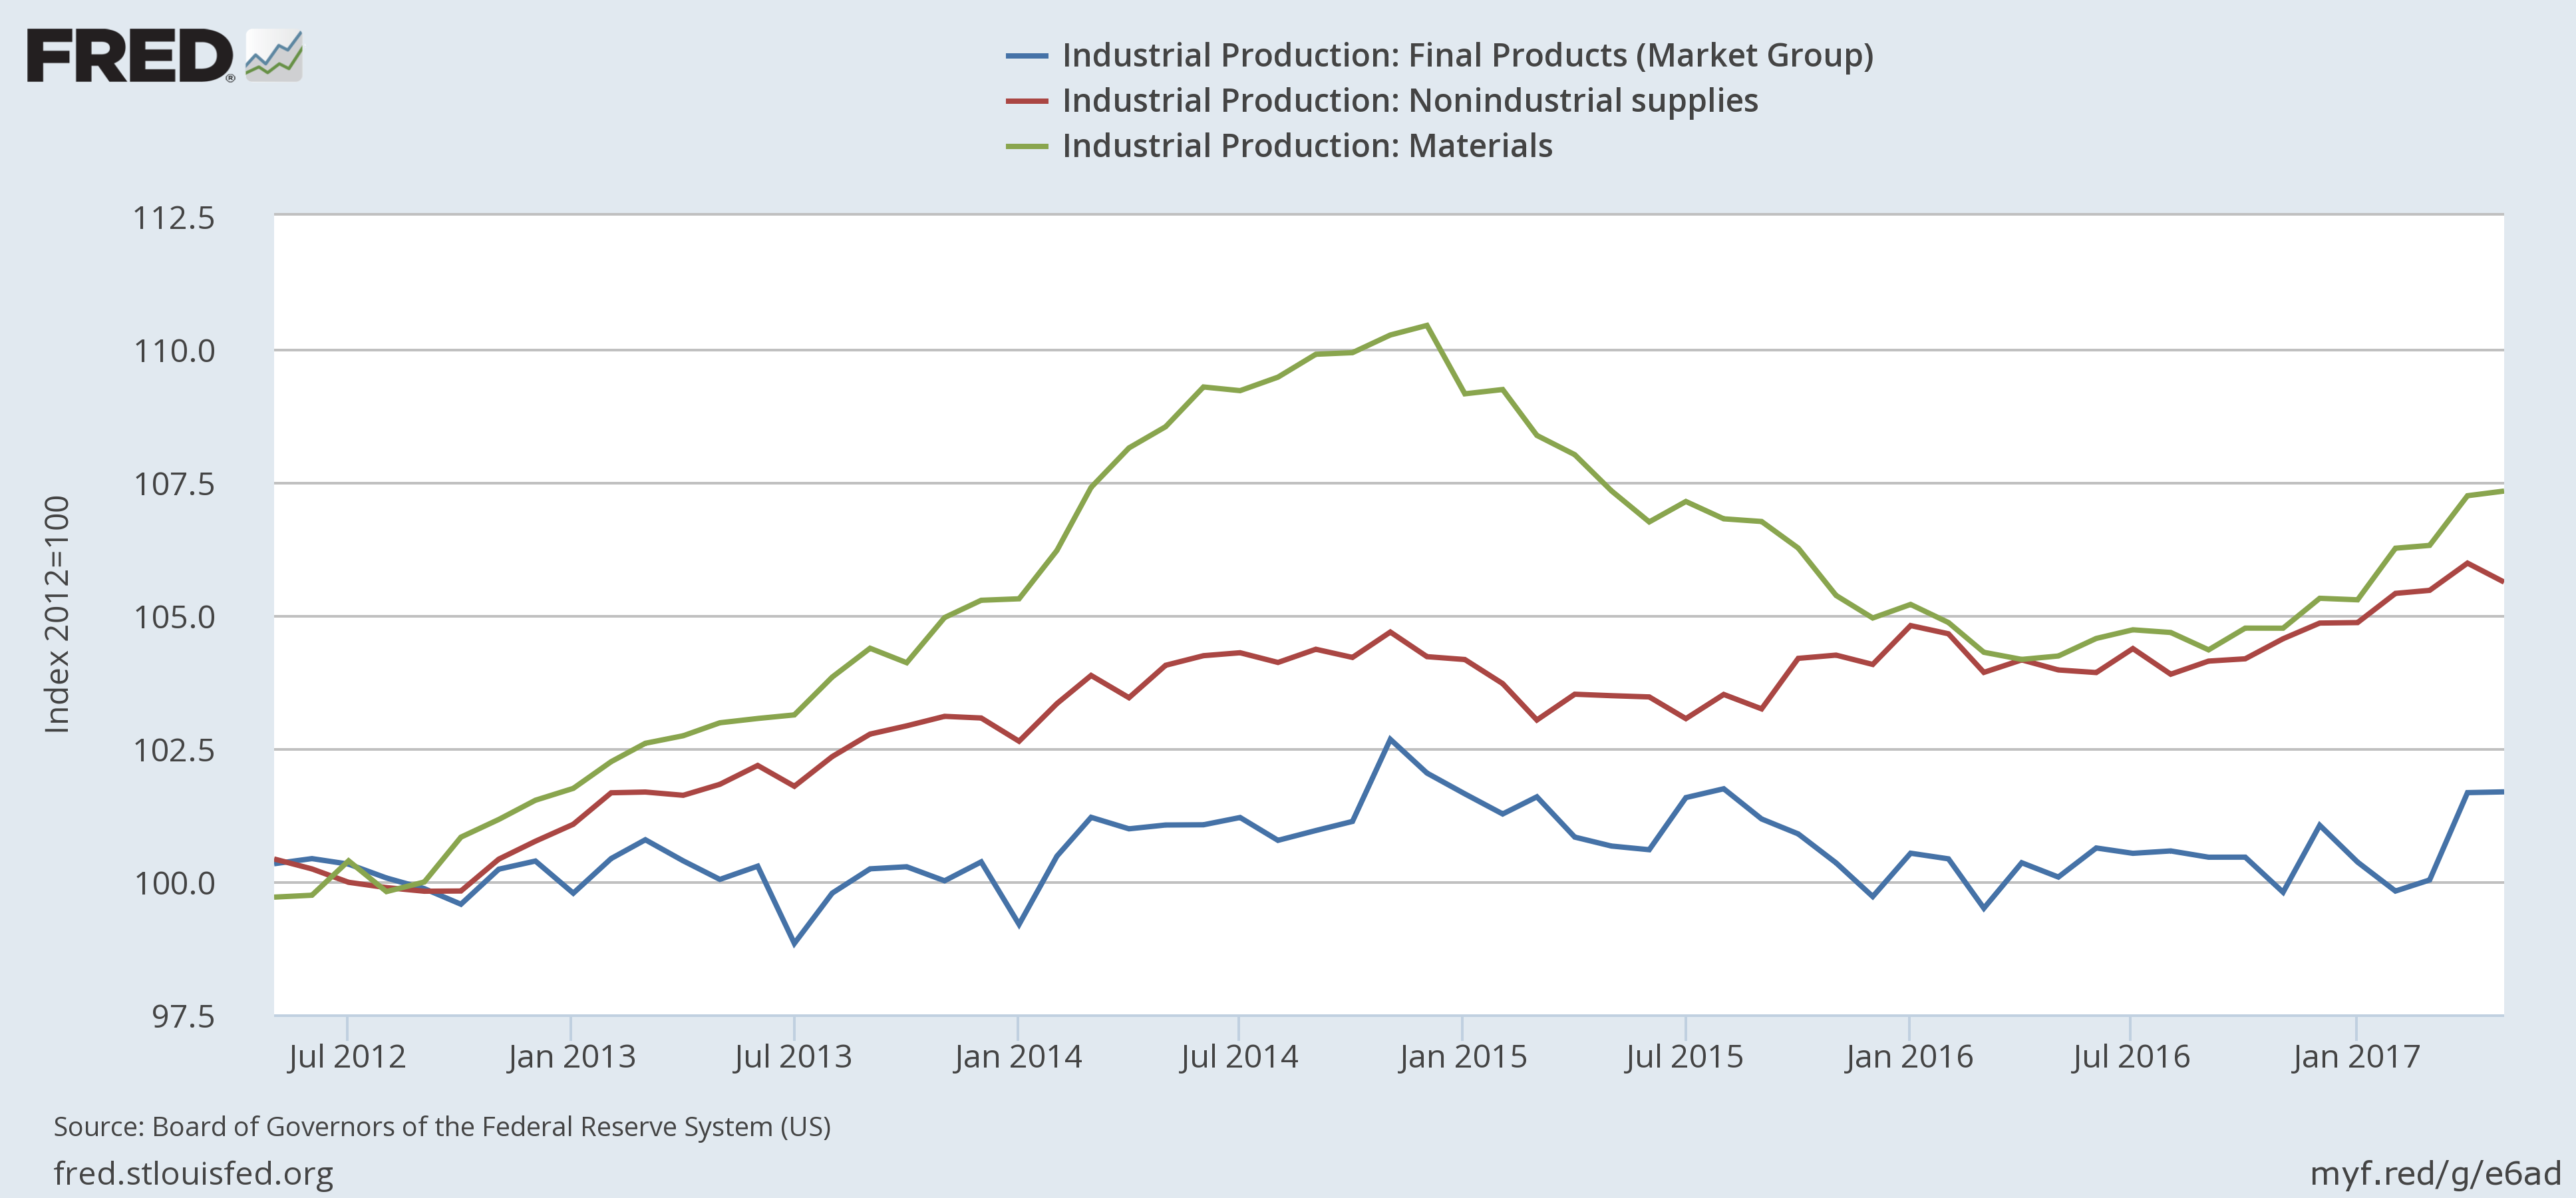

The top chart breaks the data down into market groups. Final products and non-industrial supplies (blue and red, respectively) have been stagnant for the last 5 years. Only mining (in green) has been increasing. The bottom chart breaks the data down into industries, where we see similar results: manufacturing (blue) and utilities (green) have been moving sideways. Only mining (in red) has shown any increase.
Housing permits dropped 4.9% M/M and .8% Y/Y. Despite the decline, this statistic remains at fairly high levels:

Starts were down 5.5% M/M and 2.4% Y/Y. Multi-family housing – which declined 9.8% M/M and 25% Y/Y – was the main reason for the large move lower. But even with last month’s totals, they remain in the 300,000-400,000 monthly range. vIn September-December of last year, this number saw large vacillations. But each large contraction is followed by a large expansion. It simply could be that the large December increase satiated short-term demand, which would explain the smaller decreases in each month this year.
Economic conclusion: while positive, this week’s news was disappointing; everything was just a bit weaker than projected. This is not fatal. But it could indicate that the expansion is starting to mature. This means the overall pace of everything will be a bit slower than desired.
Market Update: the markets were mixed this week: the SPDR S&P 500 (NYSE:SPY)s were slightly higher, but the QQQs (NASDAQ:QQQ) and Russell 2000s (NYSE:IWM) were off about 1% each. More importantly, the QQQs recently sold off and are now at key support levels.

Why the sell-off? A higher number of traders and investors believe that equities are overvalued. But this shouldn’t imply that an imminent sell-off is on the horizon. Instead, it’s a simple acknowledgement that equities have advanced about as far as they can for now.
Ultimately, the market’s overall situation hasn’t meaningfully changed in the last 18-24 months. Equities are expensive, which limits upside moves. But there’s also no sign of an imminent recession on the horizon, which puts a floor under stock prices. This week’s news, while weaker, could just as easily be reversed by next month’s data, so there’s no point in panicking over it just yet. Instead, take note of the weakness and be prepared to compare to the numbers that come out over the next few months to see if a pattern emerges.