Silver Slips As US Dollar Recovers
Gold and Silver are losing ground in late Asian trading today (-0.49 percent and -0.99 percent respectively) as the greenback resumes its upward trajectory following the 4th of July holiday on Friday. Also in the precious metal space; Palladium has hit its highest level in 13 years on the back of lingering production concerns coupled with a strong outlook for demand. Meanwhile, Crude Oil remains vulnerable to a continued correction as supply disruption fears in the Middle East ease.
Broad-based US Dollar strength is likely weighing on gold and silver prices in Asian trading today as the greenback finds some post-NFP follow-through. However, a light economic docket over the session ahead may leave the USD bulls lacking catalysts to spur on continued gains for the reserve currency. This could limit the extent of further falls for gold and silver.
The headline event risk for the precious metals this week is the release of the FOMC June Meeting Minutes. A downward revision to the 2014 US growth forecast alongside timid talk on rate rises from Fed officials at the June meeting left the USD uninspired. A restated dovish lean in the Minutes that accentuates potential risks to the US economic recovery could leave the US Dollar’s recent ascent to stall, which in turn may afford gold and silver some breathing room.
Palladium Hits Its Highest Level Since 2001
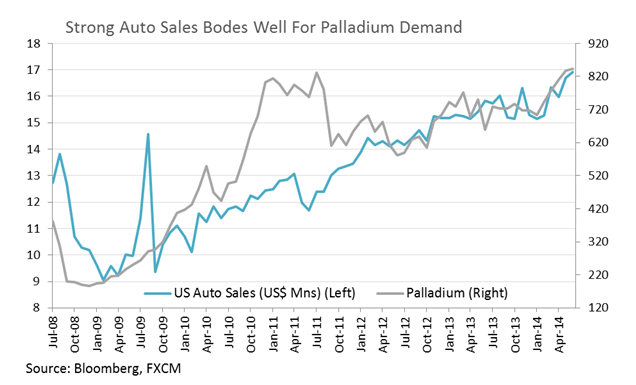
Despite the end of the South African mining workers strike last month, lingering supply concerns have likely helped propel palladium to multi-year highs in recent trading. The strike which saw over 70,000 workers down tools crippled production of Platinum and palladium over a 5 month stretch. Over the same period US auto sales rose dramatically, reflecting rising demand for palladium, which is used catalyllic converters (a key components in automobiles). If supply concerns continue to linger alongside expectations for strong demand from automakers the precious metal could remain elevated.
Crude Supply Disruption Fears Ease
WTI plunged by 1.59 percent last week, its largest decline since April, as concerns over production constraints in the Middle East abate. While fighting between the Iraqi army and militants in the country’s north continues critical oil production faclilities remain unimpeded. Additionally, Libyan rebels returned two of the nation’s key export terminals to the government last week, which stands to bolster outflows of crude. The two narratives collectively point to stable OPEC production going forward, which in turn may leave Brent and WTI vulnerable to a correction as supply disruption fears dissipate. Meanwhile a void of major economic data from the US over the next 24 hours leaves little to offer WTI guidance via the demand side of the equation.
Crude Oil: Pivotal Moment Ahead
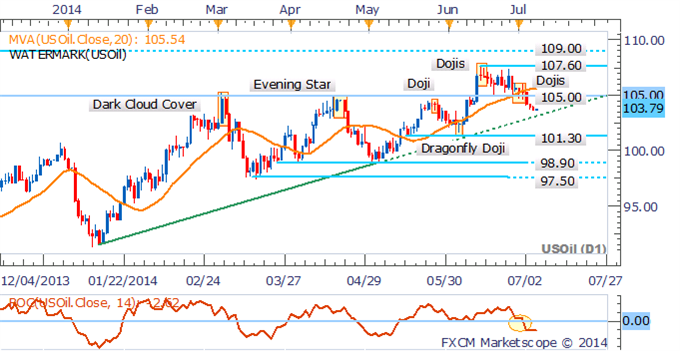
WTI faces a make-or-break moment this week as the commodity drifts towards its ascending trendline on the daily. A downside break alongside signs of a downtrend made evident by the 20 SMA and ROC indicators would pave the way for an advance on 101.30.
Gold: Pullback To Offer Buying Opportunity
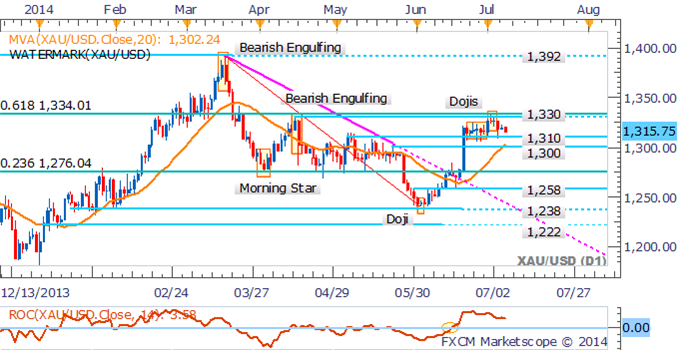
Gold continues to consolidate between 1,310 and 1,330 with several Doji candlesticks suggesting indecision from traders. However we are yet to see a meaningful reversal pattern emerge at this stage which casts doubt over the potential for a correction. Additionally signs of an uptrend (20 SMA and ROC) remain intact, suggesting a test of 1,310 could yield a bounce for the precious metal.
Silver: Holding Steady Near Key Resistance
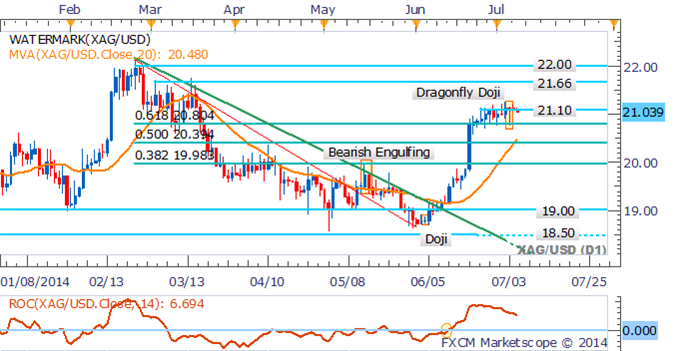
Silver traders seem to be sitting on the sidelines as the precious metal treads water near resistance at 21.10. While several Doji candlesticks suggests the potential for a reversal, with support nearby at 20.80, the extent of any correction may prove limited. Additionally, signs of an uptrend remain as noted by the 20 SMA and Rate of Change indicator.
Copper: Doji Highlights Hesitation Near 3.29
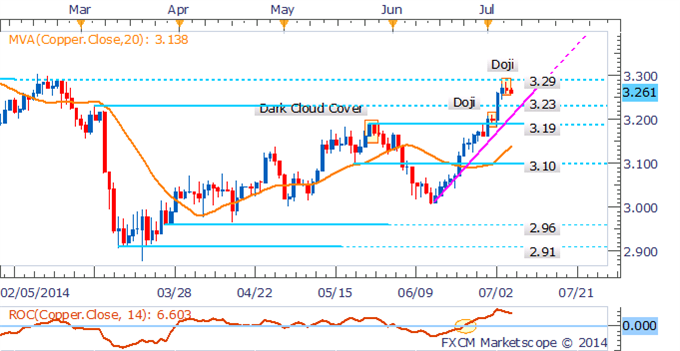
A Doji on the daily signals hesitation by the Copper bulls following a failed attempt to breach the Feb 2014 high near 3.29. However, the candlestick signal may be insufficient to signal a change in the short-term trend, which remains to the upside. Buyers will likely look to step in and support prices ahead fo the 3.23 mark.
Palladium: Clears Key Resistance
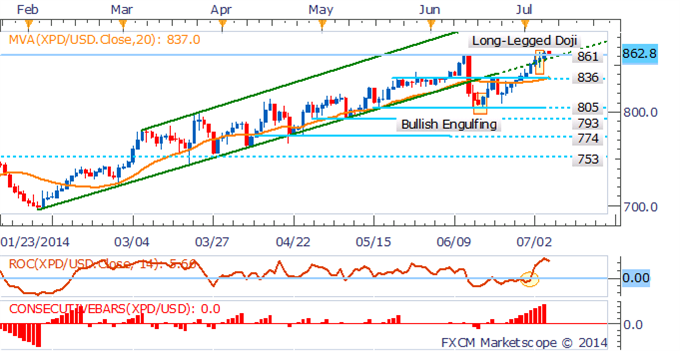
Palladium has managed to clear the 861 handle following some signs of hesitation from traders denoted by a Doji candlestick on the daily. While an extreme Consecutive Bars reading suggests the precious metal’s gains may be overextended, signs a reversal remain absent which indicates the potential for a continued advance. Current levels have not been witnessed since 2001, which leaves us to defer to psychologically-significant levels such as 900 for potential upside targets.
Platinum: Pullback Offers New Buying Opportunities
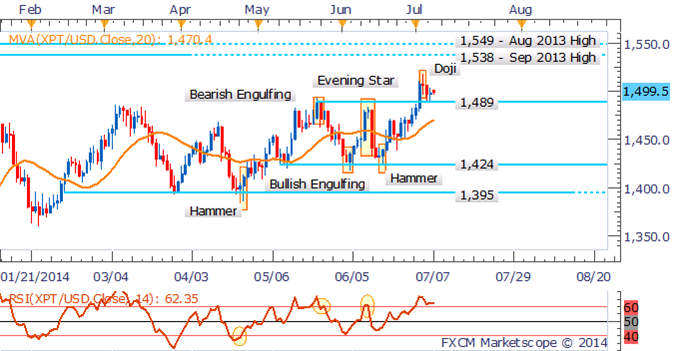
Platinum’s pullback to its original breakout point at 1,489 is seen as a new opportunity to enter long positions for the precious metal. With indications of an uptrend intact (signaled by the 20 SMA) a run on the Sep 2013 high near 1,538 may be achievable.
