I know this might sound ridiculous to some, but I think silver could reach $300.
No, I haven’t lost my mind. After all, it’s a metal that’s known for massive rallies.
You see, when silver went through its 1970s bull market, it started from a low of $1.31 in October 1971. By the time it reached its peak in 1980, silver had run all the way up to $49. That was a 37x return.
If we consider that silver was priced at $4.20 in late 2001, a 37x return would take it to about $155. However, I think this bull market could be an order of magnitude larger for a number of reasons, the main ones being debt, credit and money printing.
As a result, I think silver’s ultimate peak could be $300, and I won’t rule out possibly even higher.
Bullish Silver Fundamentals
Most developed and many developing nations have been in multi-year or even multi-decade deficit scenarios. This now looks to have become a permanent state, at least until we reach some sort of global financial reset.
The Institute of International Finance explains how the COVID-19 pandemic response added $24 trillion to the global debt mountain last year, to reach a new all-time record high of $281 trillion.
And interest rates being maintained at 5,000-year lows will only encourage more debt. Couple that with many countries borrowing to meet interest payments, and central banks soaking up much of that new sovereign debt, and inflation havens like precious metals gain strong appeal.
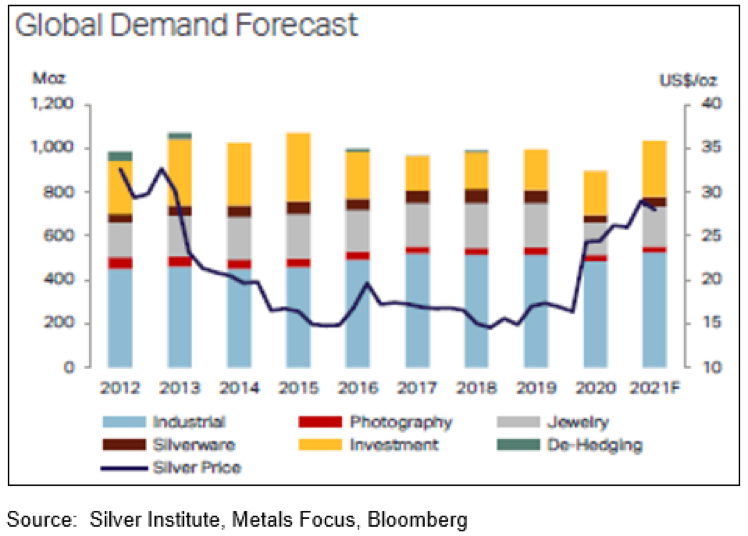
Silver in particular has the added benefit of 50% of its demand being industrial. With unprecedented economic stimulus programs, many favoring green energy, silver is uniquely positioned to profit. What’s more, according to Metals Focus, silver supply was down 4% in 2020 by 42 million ounces. According to the Silver Institute, total supply will rise by 8% this year, though total demand will rise nearly twice as much, by 15%, led by industrial, jewelry and physical demand.
So the fundamental side of silver demand is looking strong, but the technical side is also very bullish.
Bullish Silver Technicals
Let’s consider the gold-silver ratio.
As a quick refresher, the gold-silver ratio is calculated by simply dividing the spot price for one gold ounce by the spot price of one silver ounce. That’s it. Naturally the higher the ratio, the more silver ounces are needed to buy one gold ounce, and vice versa. The most bullish scenario is when the ratio is falling from a high level, ideally from above 80, and the silver price is rising.
Here’s a chart of the gold-silver ratio during the 1970s silver bull market.
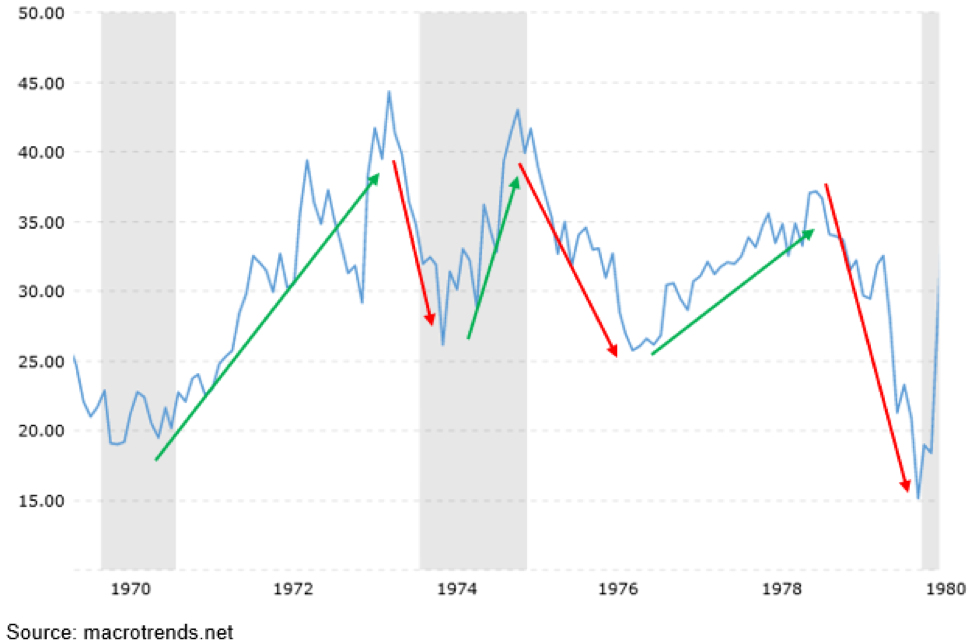
To me it’s very intriguing to note how recessions, which are the grey vertical bars, tended to mark troughs and/or peaks in the ratio. What’s also interesting is that when silver reached its peak in 1980, the gold-silver ratio ultimately bottomed around the same time at a level near 15, which was below the starting point near 20.
Let’s now move to the current silver bull market which I believe began in 2001. The following chart shows us silver prices since 2000, not adjusted for inflation.
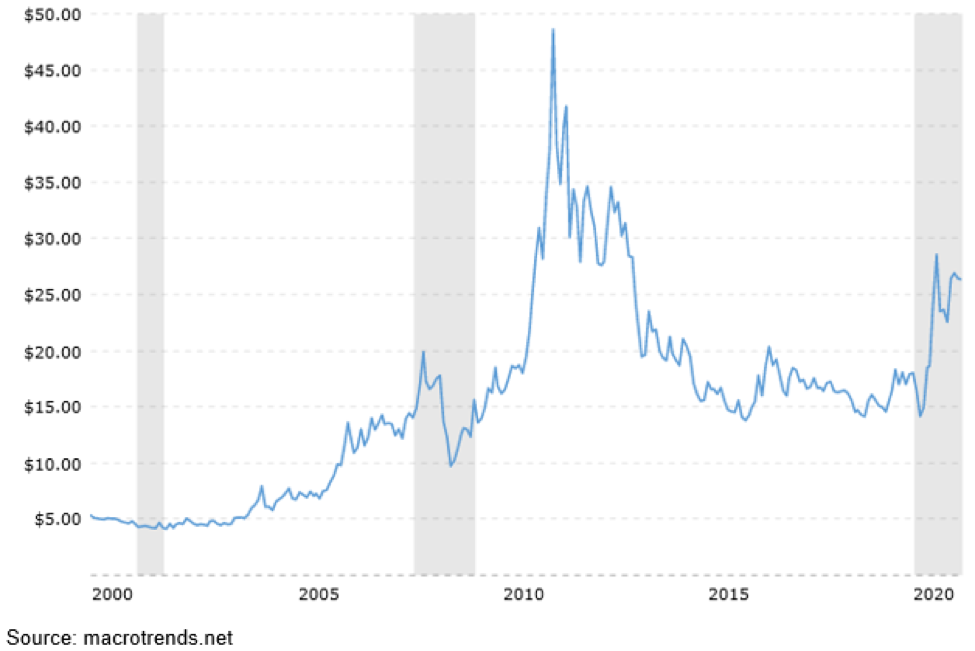
Of course, silver had a tremendous run from $4.20 in 2001 to its 2011 peak at $49. It then corrected until late 2015, then moved sideways until bottoming near $12 last year in March. It had a tremendous move up to $30 within just five months and has been mostly consolidating since.
Now let’s examine the gold-silver ratio action since 2001.
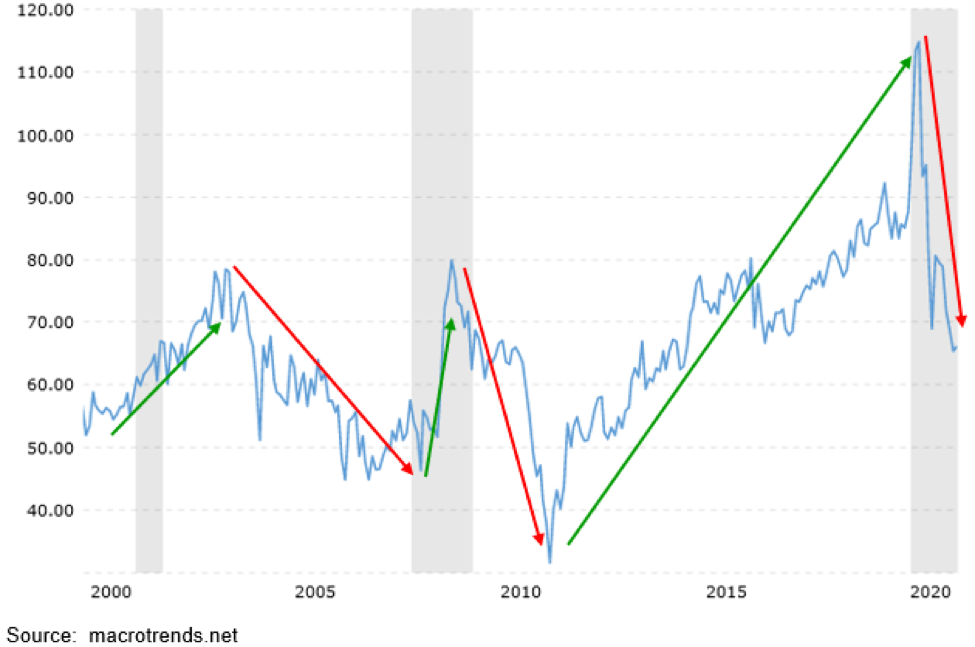
Again, we see peaks and troughs tend to occur (though not exclusively) around recessions (grey bars). At silver’s peak in 2011, the ratio bottomed near 33. It then rose almost constantly up to its all-time peak last March at 125, then fell dramatically to its current level around 67, as silver started to significantly outpace gold. Consider that we know from history silver always outperforms gold in precious metals bull markets. So the current action is particularly exciting for silver.
Silver Targets
But what does it all mean for how high the silver price can go? Of course, no one knows for sure. But there are some indicators worth examining for clues and suggestions.
I believe the ratio will ultimately reach a low near 15. And given the inflationary path we’re on, I think gold could peak at $5,000 per ounce. That’s just 2.5 times last August’s peak near $2,000. In fact, I think there’s even a decent chance gold could reach $10,000, which is just five times last August’s peak. But if we stick with $5,000, and an ultimate bottom in the gold-silver ratio of 15, we get ($5,000/15) $333 per ounce of silver.
Let’s look at silver price targets from another angle: inflation.
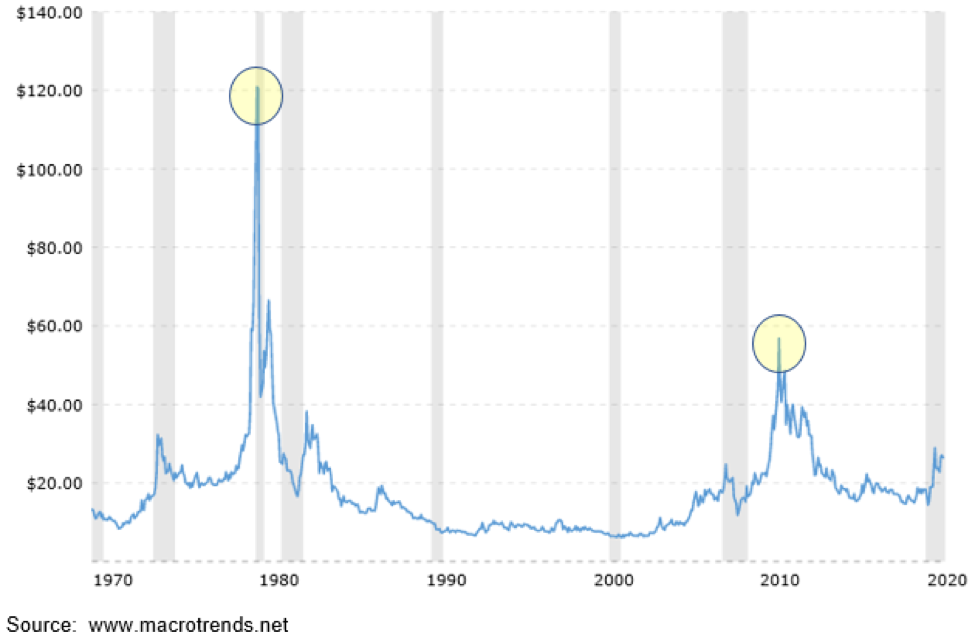
If we consider inflation-adjusted silver prices going back to 1970, we see that the peak reached in 1980 was actually $120/ounce in today’s dollars, and that’s using government sanctioned inflation statistics, which tend to be well below what we experience in everyday life.
Considering the old way of calculating inflation, which the U.S. abandoned decades ago and I reference below from Shadowstats.com, a realistic inflation rate would have averaged 7% - 8% since 1980 (triple official inflation), which would mean an equivalent silver price of $240-$360 at the 1980 peak.
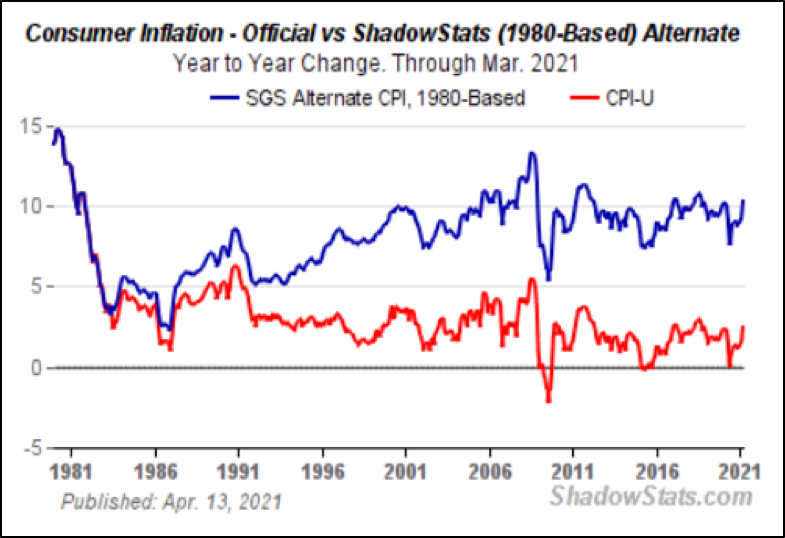
My gold-silver ratio target for silver of $333 is comfortably within the range of $240-$360. If we take the mid-way point between $240 and $360, we get $300. I think that’s as good an estimate as any of where silver can peak in its current bull market.
On this basis, the silver price would need to be up by more than 10x from current levels to reach its ultimate high. Imagine for a moment, if silver were to soar tenfold from here, what the silver producers’ and silver explorers’ share prices would do. It’s not difficult to expect simply spectacular returns. Which is exactly why it’s so attractive to allocate to this space, while being diversified across several stocks, as it’s impossible to know which will do best. Still, odds are very good that if silver goes up by a factor of 10, the average silver stock should easily double that, and be up by a factor of 20, while the most successful juniors could gain 50x or more. That would simply be a repeat of previous bull markets.
Larger silver producers and royalty companies should be seen as core positions to be held for the long term. The more junior explorers should be treated more cautiously as speculations, on which to take profits when they materialize. Selling half of one’s position on a double would be especially sensible.
In any case, I believe it remains early days for silver and silver stocks. I expect to see much higher prices ahead in the metal and the equities. And in my view the current bout of weakness is an opportunity to buy or add to positions in this space. Remember, at $26 silver is still nearly 50% below its all-time nominal high, while gold is just 10% below its all-time nominal high. Silver is clearly the better relative bargain.
I think silver is currently at or very close to its bottom, but that its ultimate peak could well be in the $300 range.
Either way, silver is headed much, much higher.
