Spot silver is trading around $26 per ounce, but you can’t buy any at that price.
Instead, you’ll have to pay almost 50% more.
That’s right. If you want silver right now, you’ll need to pay at least $35 per ounce.
If you prefer government mint coins, and you’re willing to wait a month to get them, you’ll have to pay upwards of $37 per one-ounce coin.
In the past year premiums on physical silver have tripled from normal levels. Bullion dealers have been overwhelmed. Product shortages are now commonplace, with customers waiting three weeks or longer for shipping.
The silver market has rarely, if ever, experienced anything like this. Demand has not only soared; it has maintained these elevated levels.
So what’s changed? A lot. From social media attention and falling mine supply, to safe haven and industrial demand, the silver market is on fire. And most signs indicate this trend is only going to intensify.
Sustained Silver Tsunami
In late January, a Reddit WallStreetBets (WSB) subpost triggered a call to action to buy silver. Bullion dealers were immediately shocked by a tsunami of buying. To be fair, that’s happened before. But this time has been different, as the buying wave has yet to let up.
At the start of February Alessandro Soldati, CEO of Swiss dealer Gold Avenue said, “Demand was 10 times a typical Sunday yesterday, and today I would say six times… Everyone is calling us saying ‘I want to buy gold and silver ASAP.’” That echoed what numerous other dealers were experiencing.
Silver’s price spiked from $25 to $31 before subsiding. But demand for physical silver hasn’t. And it seems it’s unlikely to diminish for some time yet.
Although this has been a massive buying wave, silver demand actually first jumped back in March 2020 as the initial COVID-19 shocks caused much of the world’s economy to shut down. Since then, silver’s been hot, and by all accounts that seems likely to continue.
Silver gained an impressive 47% in 2020, and has been trending sideways for the past nine months. But based on fundamentals and technicals, the metal appears set for strong gains again this year.
Elevated Investment And Industrial Demand
The Silver Institute (the Institute) recently forecast global silver demand would rise 11% in 2021, to reach 1.025 billion ounces. They argue that improving macroeconomics are supportive of silver’s main demand drivers.
Based on sustained robust buying over the past year, it’s not surprising the institute expects physical demand will reach a six-year high of 257 million ounces. Global silver ETP (exchange traded products) holdings were up an astounding 331 million ounces. in 2020 alone, to reach 1.04 billion ounces. That’s more than an entire year’s supply of silver from mining, recycling and hedging. Then, from Jan. 1 to Feb. 3 this year alone, ETP holdings soared another 137.6 million ounces to a new record 1.18 billion ounces.
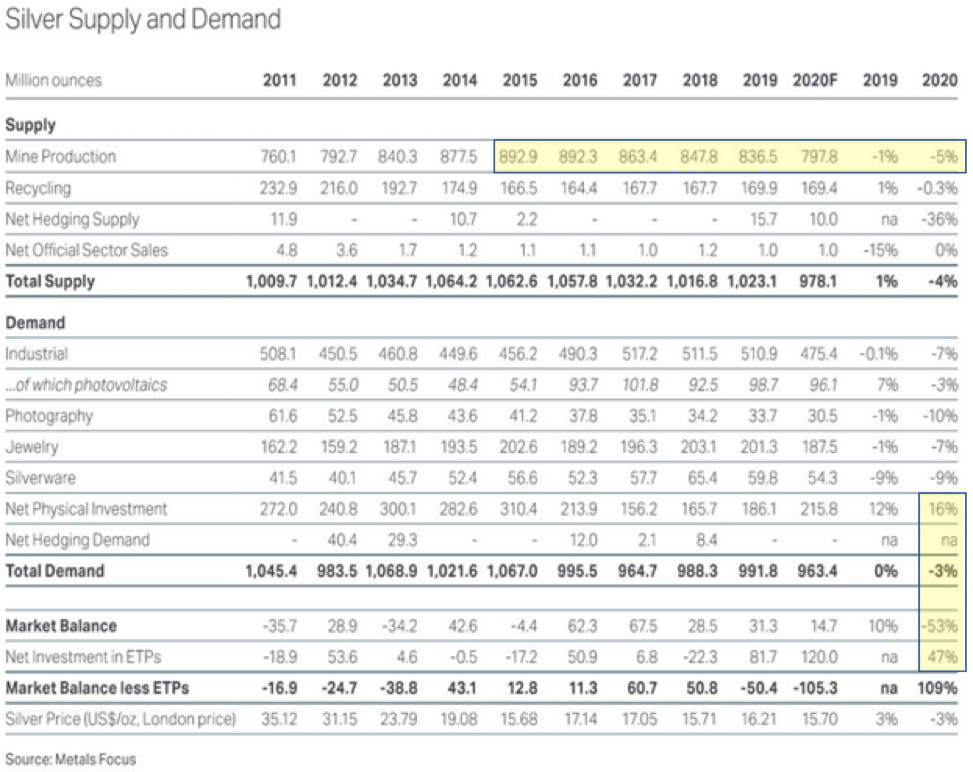
As we can see from the following table, net physical investment was up 16% last year, after already gaining 12% in 2019. At the same time, mine supply has been falling steadily since 2015, dropping 5% in the last calendar year.

A recent analyst report from Heraeus Precious Metals said they foresee silver prices outperforming gold again this year, spurred on by rising inflation and burgeoning industrial demand as the economy recovers from the COVID-19 pandemic. The analysts said:
"Consumption from industrial end-users is forecast to extend to a four-year high of 510 [million ounces] this year, with strong growth from the electrical & electronics and photovoltaic (PV) sectors." They went on to say, "Last time the five-year breakeven inflation rate was this high was in 2011 and silver was trading around $48/oz, almost double the current price. With precious metals seen as an efficient hedge against inflation, higher inflation expectations should provide upside for silver."
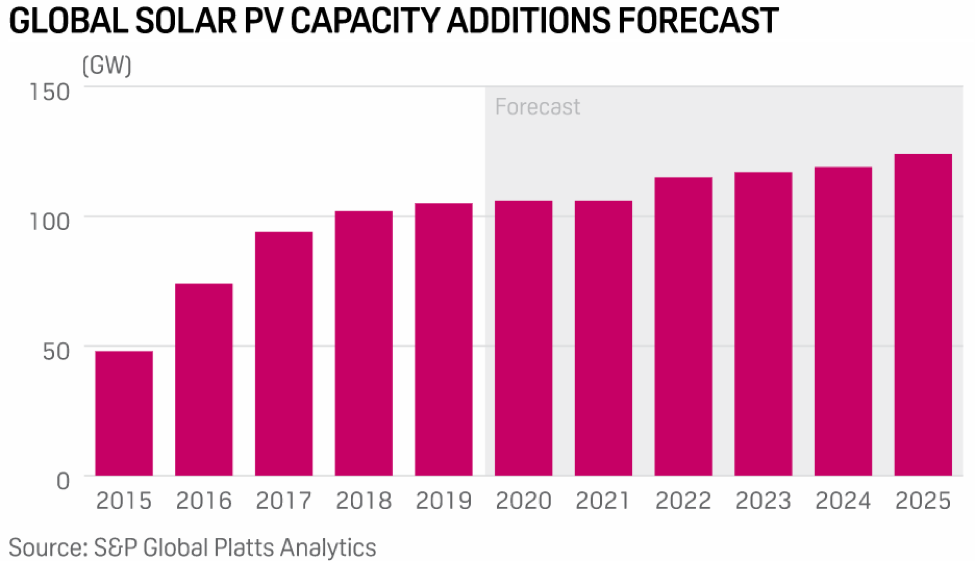
The Silver Institute also sees industrial demand to be sizeable, reaching a four-year high of 510 million ounces, up 9% over 2020. They expect electrical and electronics demand to drive the increase, as 5G technology helps push the sector’s consumption to 300 million ounces. The Institute sees gains from the PV (photovoltaic/solar) sector reaching 105 million ounces, or about 10% of total demand. Solar panel manufacturers have gradually lessened the per unit silver consumption, but that has practical limits. According to S&P Global (NYSE:SPGI) Platts Analytics, global installations of solar panels are forecast to grow 7% or roughly 8 GW/year into 2025, citing supportive government policy developments globally.

The Institute forecasts silver requirements from the automotive sector to be especially vigorous. With demand at 50 million silver ounces in 2020, it’s expected to jump 80% to almost 90 million ounces by 2025. EVs use 25-50 grams per vehicle: nearly double the silver requirements of internal combustion engine technology. Deloitte consulting sees EV sales accounting for nearly one third of all new vehicle sales by 2030.
In addition, printed circuit boards in electronics make up the largest single demand sector, at 30% of total demand (60% of industrial). There is currently a shortage of semi-conductors, exacerbated by the pandemic as demand has shifted towards TVs, home computers and game consoles. In effect, this pent-up demand can be seen as an opportunity as industry strives to meet it with silver supply.
Acceleration Has Begun
In previous precious metals bull markets silver has typically outpaced gold’s gains. I don’t expect this time will be different. And given the outsized gains silver produced last year, doubling gold’s return, we could well be on our way towards that outcome. The gold silver ratio may be the most telling indicator pointing to this scenario.
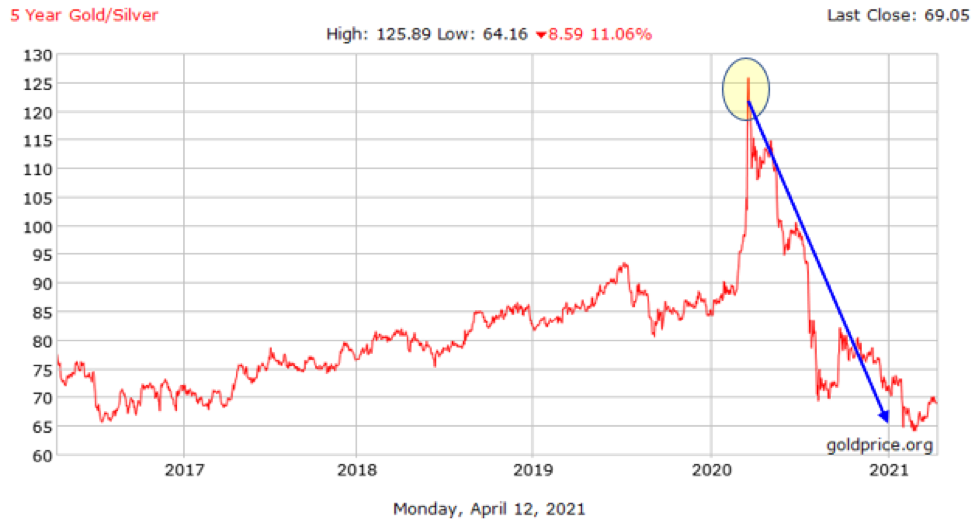
The gold-silver ratio had been trending upwards since 2016, then rapidly peaked at an all-time record high near 125, marking a clear turning point.

From there the ratio fell rapidly and dramatically, as it was cut almost in half within just 12 months.
Although both gold and silver prices have risen since the ratio’s peak at 125, silver’s gains have clearly outpaced gold’s on nearly a 2-to-1 basis.
Bank of America’s commodity analysts said in a recent report that they see silver averaging near $30 this year. They cite an expected 281-million-ounce supply shortage and 9% higher industrial demand. And Goldman Sachs (NYSE:GS) recently repeated its bullish view on silver, saying it projects the metal’s price to reach $33 per ounce, spurred by President Joe Biden’s drive towards increasing renewable energy.
All these indicators – sky-high premiums on silver coins and bars, demand forecast to keep rising, and a rapidly falling gold silver ratio – are painting a very bullish picture for silver.
And that’s why I believe the silver bull market has entered the acceleration phase.
Wise investors definitely won’t want to be left behind. Now’s the ideal time to start buying silver equities.
