No results matched your search
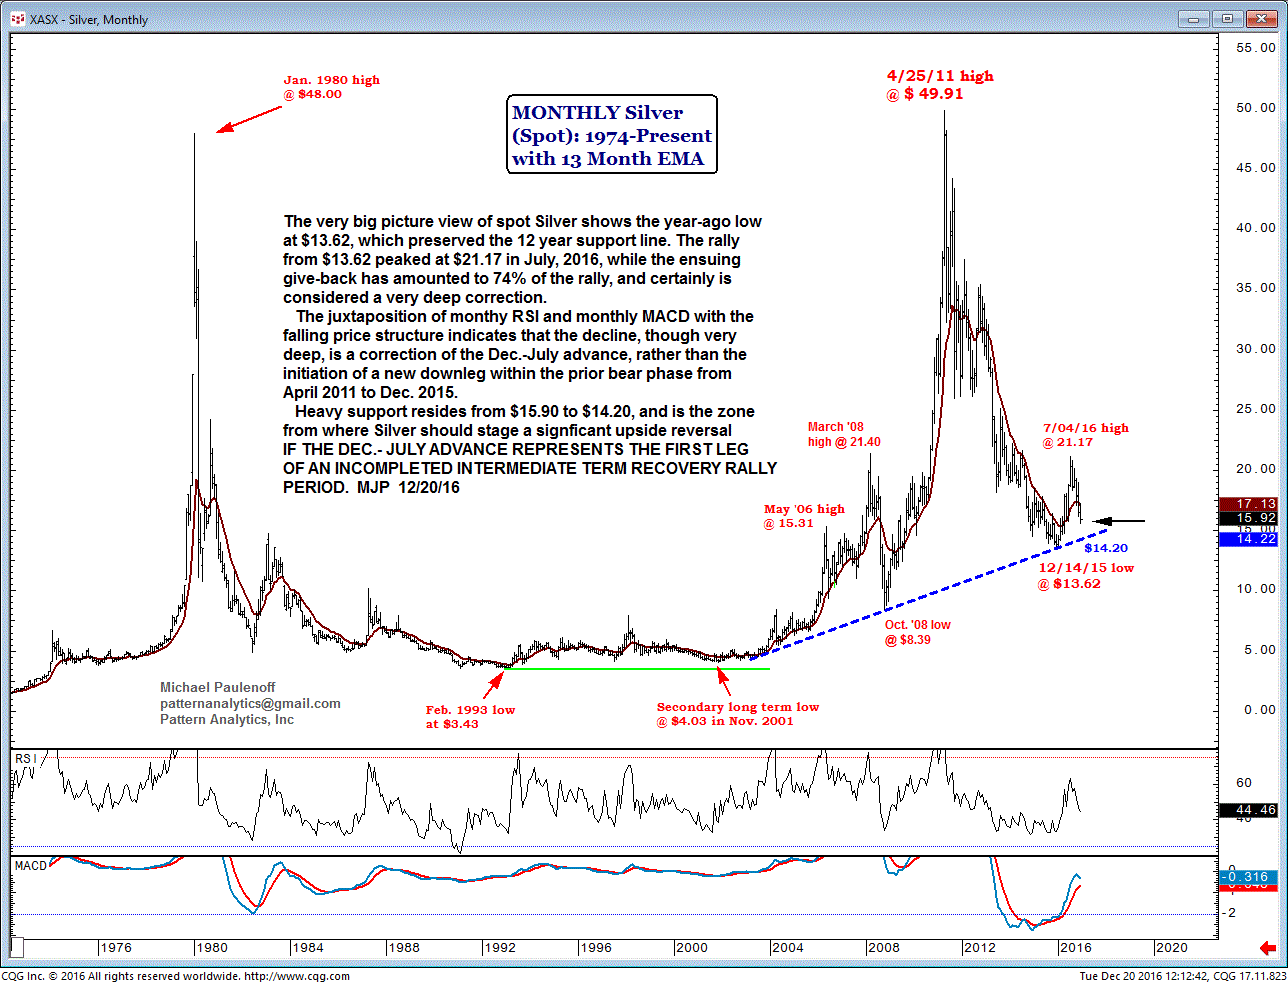
The big-picture view of spot silver shows the year-ago low at $13.62, which preserved the 12-year support line.
The rally from $13.62 peaked at $21.17 in July, 2016, while the ensuing give-back has amounted to 74% of the rally and is certainly considered a very deep correction.
The juxtaposition of monthly RSI and monthly MACD with the falling price structure indicates that the decline, though deep, is a correction of the Dec.-July advance, rather than the initiation of a new downleg within the prior bear phase from April 2011 to Dec., 2015.
Heavy support resides from $15.90 to $14.20, and is the zone from where silver should stage a significant upside reversal if the Dec.-July advance represents the first leg of an incomplete intermediate-term recovery rally period.
Are you sure you want to block %USER_NAME%?
By doing so, you and %USER_NAME% will not be able to see any of each other's Investing.com's posts.
%USER_NAME% was successfully added to your Block List
Since you’ve just unblocked this person, you must wait 48 hours before renewing the block.
I feel that this comment is:
Thank You!
Your report has been sent to our moderators for review
Add a Comment
We encourage you to use comments to engage with users, share your perspective and ask questions of authors and each other. However, in order to maintain the high level of discourse we’ve all come to value and expect, please keep the following criteria in mind:
Perpetrators of spam or abuse will be deleted from the site and prohibited from future registration at Investing.com’s discretion.