In his book Nobody Knows Anything, my friend Bob Moriarty wrote about the difference between signal and noise. Unfortunately, much of the information in the gold space or what passes for such is really noise. Conspiracy theories around manipulation, price suppression and China are all too popular while important factors like real interest rates, investment demand and gold’s relationship to equities are neglected. At present the Gold market has experienced a critical breakdown yet in some circles a new theory and explanation is gaining traction.
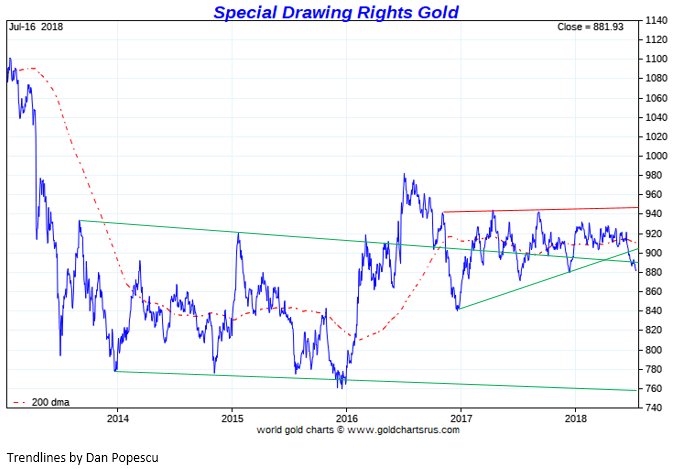
Last week more than a handful of subscribers alerted me to Jim Rickards’ belief that China has pegged the SDR (an IMF reserve currency) Gold price from 850-950 SDR/oz and this is what is impacting the Gold price. Rickards writes that the peg is too cheap given the scarce supply of Gold and that the IMF will print trillions of SDRs during the next global financial crisis. It’s a signal that China is betting on the SDR and Gold, he says. He also tweeted that at the Sprott Investment Conference he would present the evidence of the new gold standard at 900 SDR/oz.
First, the supply of Gold is not scarce. The supply of Gold actually grows in perpetuity because Gold is not consumed like other commodities.
Second, let’s look at the chart of the Gold price in SDRs, kindly provided to me by Dan Popescu. Sure, it has traded from 850 to 950 for the past 18 months but that does not imply a peg or some behind the scenes price management. Everyone following precious metals knows the market has been locked in a very tight range for many months.
However, technically speaking the Gold price in SDRs has broken down from a large, bearish consolidation and the implication is price will continue to trend lower. I expect it will test that low at 840 and ultimately trend towards its 2014-2016 lows before its next bottom.

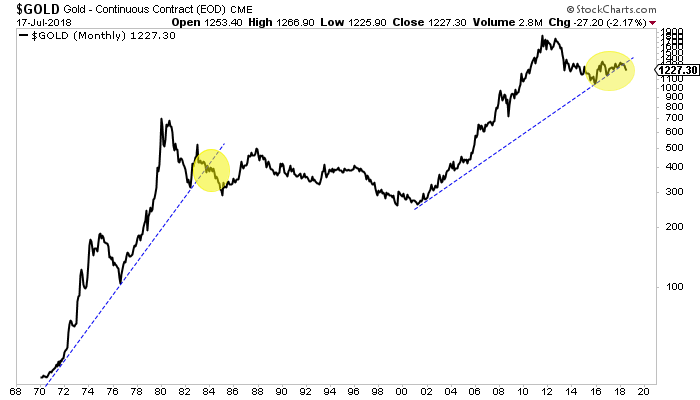
It is an ominous looking chart (above) and so is this one (below).

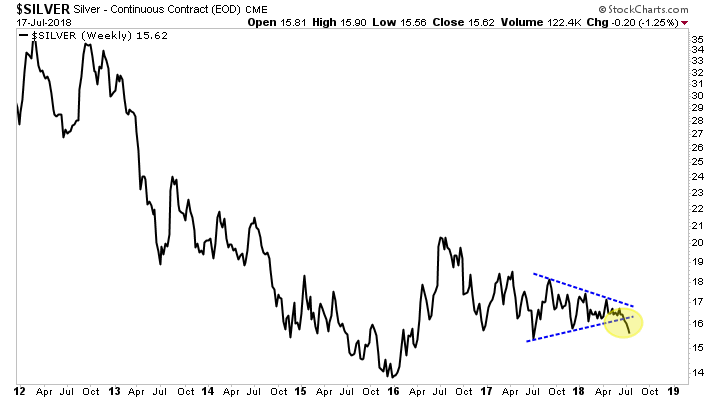
And it’s not just Gold. Here is Silver, breaking down from a triangle consolidation.

We’ve written about the reasons for Gold’s struggles (stable real interest rates, rising stock market, renewed dollar strength) and what it will take for its next bull market to take hold.
That being said, great traders don’t focus on the why. They focus on the price action.
The message of the market is quite clear. Gold and Silver were trading in ranges but they are now breaking to the downside. Sentiment data is certainly sending bullish signals for a counter-trend rally (and it may have begun Wednesday) but I digress.
Price action, fundamentals and sentiment data are what we call signals. They come from real data that can be verified. Interpretations can differ, but the data is factual.
The view or belief that China is pegging the SDR or creating a new gold standard at 900 SDR/oz or will revalue the Gold price higher in due time is noise. It’s not based on anything that can be verified. Its merely an opinion of someone purported to be an “insider.” Moreover, if the new downtrend in Gold is sustained then the SDR price will decline and the theory of a peg or new gold standard would be quickly disproven.
With all due respect, we need to focus on signals and not conspiracy theories that can’t be proven or verified and don’t help anyone make money. That’s noise. Regardless of the veracity of the aforementioned theory, Gold and Silver have broken down technically and could trend lower after a relief rally.
