The mainstream financial media love to tell you, “Bull markets don’t die of old age.” True enough. Indeed, the current uptrend remains a shining example of cyclical durability and persistence.
For many, then, the fact that the stock bull has set an all-time record in length is cause for celebration. 3,453 days and counting. If you choose to listen, Kool & The Gang will even let you know where the party is at.
It is worth noting that the S&P 500 needs to close above its January 26 high of 2872.87 to keep the title of the “Longest Bull Market In History.” Otherwise, it may wind up finishing 2nd in the record books.
Technicality notwithstanding, U.S. stocks are still powering higher. They’ve made careful investors seem like out-of-touch fogeys. And they’ve made capital consciousness sinful.
It is true that I am one of those fogeys. Since the start of 2015, I have been more cautious. I have participated at a lower-than-typical allocation for my retiree and near-retiree client base (50%-60% rather than 65%-70%). Nevertheless, I have maintained the bulk of the risk-on allocation.
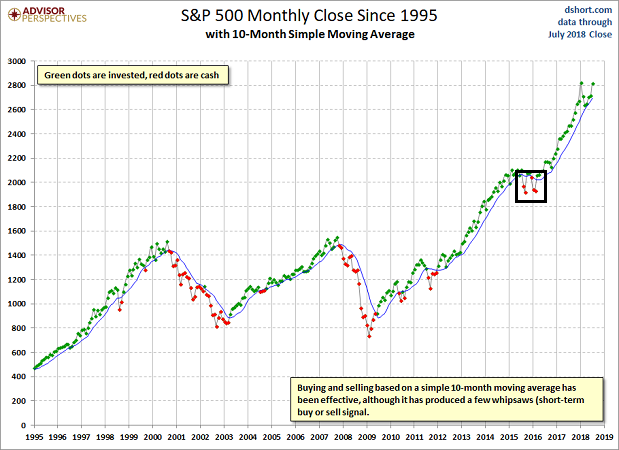
As a risk manager, I dedicate capital to stocks when the monthly close of the S&P 500 is above its 10-month simple moving average. I allocate less to stocks when the monthly close falls below the 10-month moving average. This discipline made it possible for me to minimize the severity of the 2000-2002 tech wreck as well as the 2008-2009 financial crisis.
With the trend so favorable, why have I chosen to take any chips off of the proverbial table? After all, returns could lag for years.
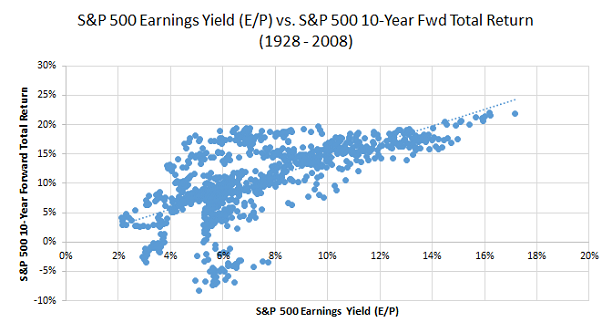
One factor is the longer-term outcome(s) when paying an extraordinary price premium. For example, since 2015, the S&P 500’s P/E has regularly situated itself in the most expensive decile of valuation. Forward return prospects are poor when accounting for the risk one is taking at the highest decile(s).

One can even invert the ratio (E/P) to view a picture of the “earnings yield.” For instance, at this moment, earnings data at the S&P Dow Jones web site ($122.63) place the E/P at 4.2%. It does not require extensive examination to see that lower earnings yields are typically followed by weaker forward returns.
There’s more. Earnings per share use in valuation might be misleading due to corporate accounting sleight-of-hand (non-GAAP), one-shot year-over-year tax comparisons as well as stock share buybacks.
Consider the reality that bottom-line, profits-per-share have grown nearly 300% for the S&P 500 since 2009. Top-line revenue? 30%. A tenfold difference!
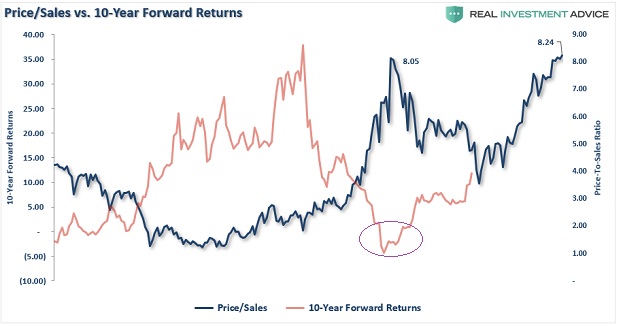
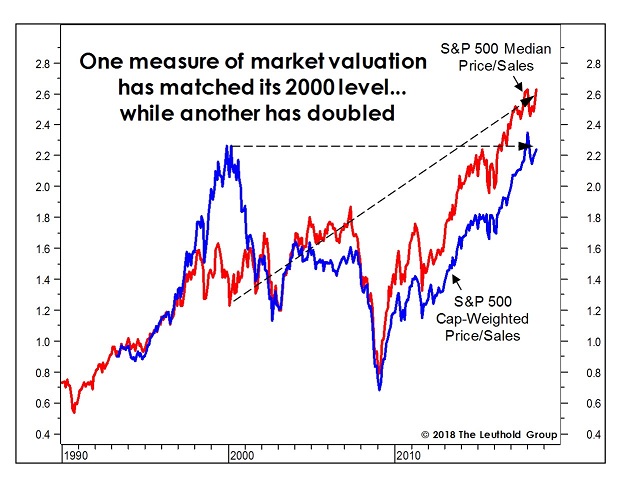
Investors may want to be cognizant of the reality that the S&P 500’s price-to-sales has actually exceeded the levels associated with the dot-com tech bubble of 2000. In that vein, they may want to be mindful of the 10-year forward return prospects for stocks under those circumstances.
In truth, the extraordinary overvaluation in the price-to-sales metric is worse for the median stock in the S&P 500. Whereas the metric for the market-cap weighted index is merely in line with the tech bubble’s 2000 peak, the median S&P 500 stock’s price-to-sales ratio is more than twice as “irrationally exuberant.”
I know, I know. Increasing risk lower (a.k.a. “buying low”) and reducing risk higher (a.k.a. “selling high”) is an antiquated notion. Only a fogey would dare consider it.
Nevertheless, risking a little less capital today is a small thing in a big picture. Getting 2.2%-2.4% on a stash of cash equivalents offers one the ability to take advantage of opportunity when the herd eventually loses its collective mind.
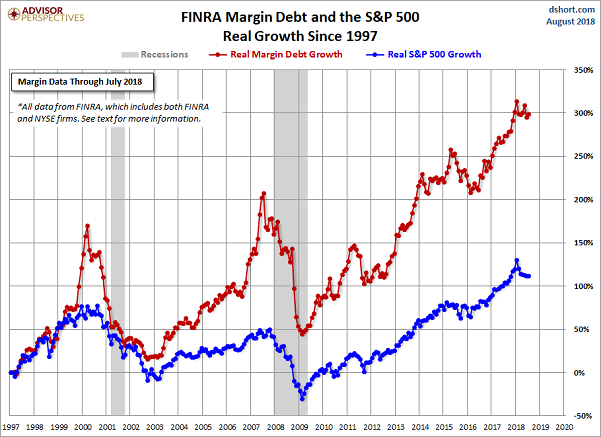
Why should you believe that a bearish price storm could be particularly brutal in its punishment? Excessive leverage in the system.
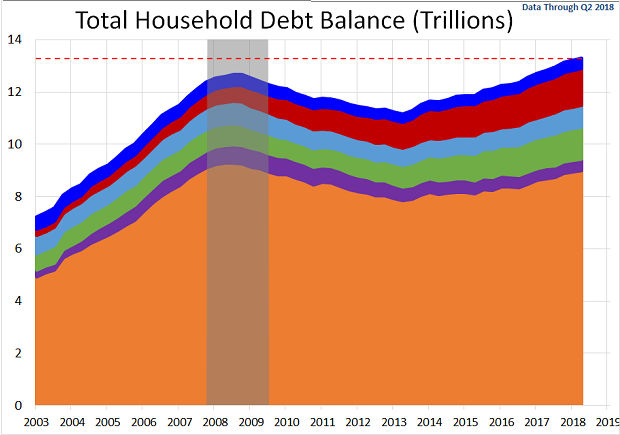
At the household level, total debt has ratcheted up to unsavory heights. The notion that this remains manageable due to low interest rates on an absolute basis ignores the changes that have already transpired and the ongoing Federal Reserve campaign. To wit, mortgage applications are in the process of turning negative year-over-year, refinancing is at an 18-year low and existing home sales are stuck in their longest downward slump since 2013.
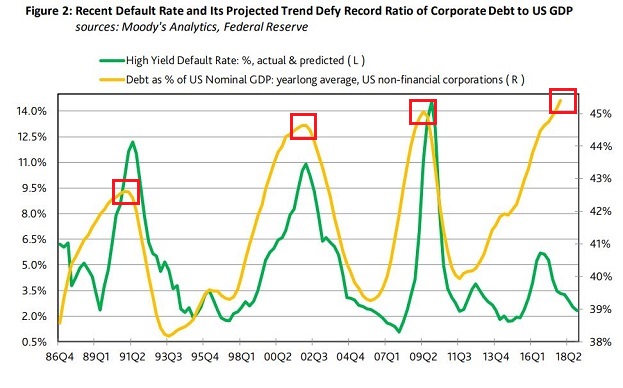
Surely, S&P 500 corporations are in much finer shape, right? Not entirely. Speculative-grade or “high-yield” borrowers have cash-to-debt ratios at 12% (2017). That’s even lower than the 2008 figure of 14%. Meanwhile, if you strip out the top 1% of cash-rich bond issuers, there are 450-plus “investment-grade” corporations with abysmal cash-to-debt ratios around 21%.
Granted, until these companies have to roll over trillions of debt in the coming years, the debt binge may stay inside Pandora’s Jar for a while longer. On the flip side, is it truly sensible to ignore the peaks for corporate-debt-to-GDP? Each previous top has been associated with significant bear market price depreciation (i.e., 1990, 2000, 2008).
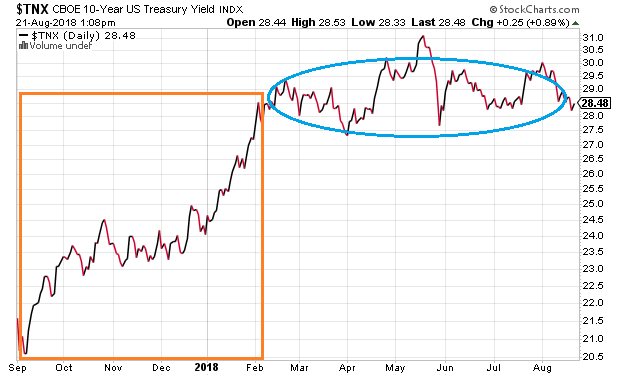
It is sensible to acknowledge that so much of the leverage issue comes down to interest rates. When the 6-month trend spiked 75 basis points on the 10-year U.S. Treasury, it led to the January correction. In the half-year period that followed, containment in and around 2.85% has alleviated much of the trepidation surrounding Federal Reserve balance sheet reduction and overnight lending rate hikes.
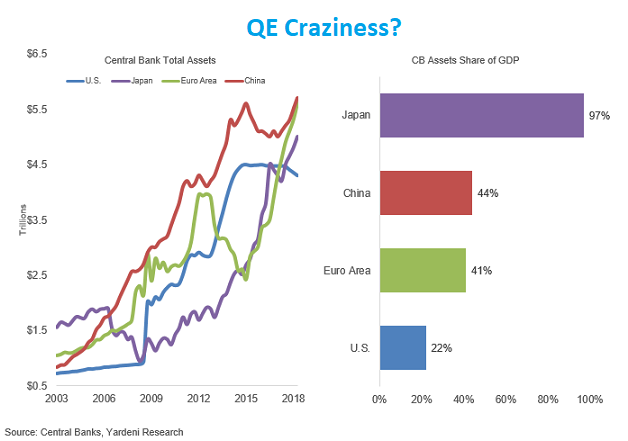
Even if there are no shocks in the near-term for U.S. households or corporations, should you believe that foreign countries have everything under control? Recently, the Bank of Japan had to go on a massive buying spree to intervene when its 10-year equivalent rose from 0.03% to 0.11%.
That’s correct. The world’s third largest economy must keep rates near 0% to avoid bankrupting itself. Japan already spends nearly 25% of its revenue on debt servicing alone. And with its debt-to-GDP at approximately 225%, is it reasonable to ponder the Bank of Japan’s quantitative and qualitative easing craziness?
Nothing to worry about until there’s something to worry about? Certainly, this is true to some extent. That is why the trend-following discipline described in the initial chart serves as my most important indicator.
That said, far too many folks ignore the self-fulfilling nature of contagion. Central banks were able to contain the 1998 Asia Currency Crisis and the 2011 sovereign debt crisis in Europe, as the S&P 500 only fell 19% in each of those turbulent periods. Yet they weren’t as successful in containing the contagious effects of “subprime” in 2008 nor the extremes in leverage in 2000.
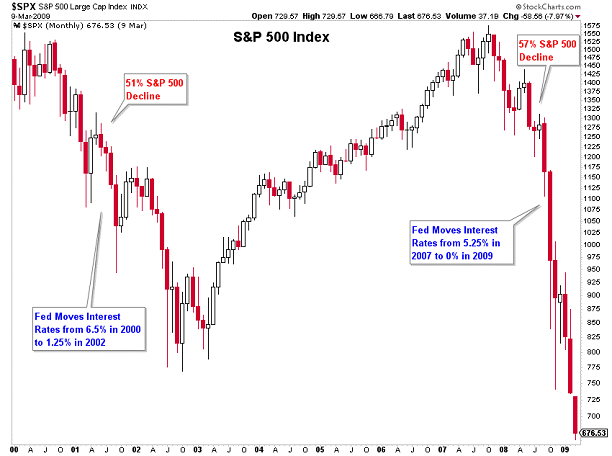
Celebrate the longest bull market in history if you must. Then again, if you don’t mind being a fogey, have an insurance plan for the possibility that something spins out of control.
My insurance plan involves the trend-following nature of the monthly close on the 10-month moving average. It also involves holding a little more cash when valuations are stretched and leverage levels (e.g, household, corporate, government, margin account, etc.) are hitting extremes.
Disclosure Statement: ETF Expert is a web log (“blog”) that makes the world of ETFs easier to understand. Gary Gordon, MS, CFP is the president of Pacific Park Financial, Inc., a Registered Investment Adviser with the SEC. Gary Gordon, Pacific Park Financial, Inc., and/or its clients may hold positions in the ETFs, mutual funds, and/or any investment asset mentioned above. The commentary does not constitute individualized investment advice. The opinions offered herein are not personalized recommendations to buy, sell or hold securities. At times, issuers of exchange-traded products compensate Pacific Park Financial, Inc. or its subsidiaries for advertising at the ETF Expert website. ETF Expert content is created independently of any advertising relationship.
