The Mainstream media continues to delude the public into believing cheap shale oil production will make the United States energy independent. We now see articles suggesting that Americans will no longer need to rely upon the Middle East or OPEC for our future oil supply when all we need to do is ramp up our domestic shale oil production. Unfortunately, its not that simple or easy.
Matter-a-fact, the United States will never become energy independent because domestic shale oil production suffers from seriously high annual decline rates. What does that mean? That means, every year the top shale oil fields lose a massive amount of oil production, which can only grow by adding an even higher amount of new oil production… via a tremendous amount of drilling.
For the United States to become energy independent, it would have to produce an additional 4.5 million barrels of oil per day (mbd). Even though we import more than 7 mbd of crude oil, our net imports are 4.5 mbd. We export the remainder as various petroleum products.
Currently, the top four shale oil fields in the United States (Permian, Eagle Ford, Bakken Energy and Niobrara) produced 4.8 mbd of oil. So, for the United States to become oil independent, we would have to double current shale oil production in these top four fields.
You see, that is a huge undertaking because these top shale oil fields are suffering from extremely high annual decline rates. The EIA – U.S. Energy Information Agency labels this decline as a “Legacy Decline.” I will label it as an “Annual decline rate” in this article. So, how bad are these annual decline rates? Let’s start by looking at what is taking place in the Bakken Field in North Dakota:
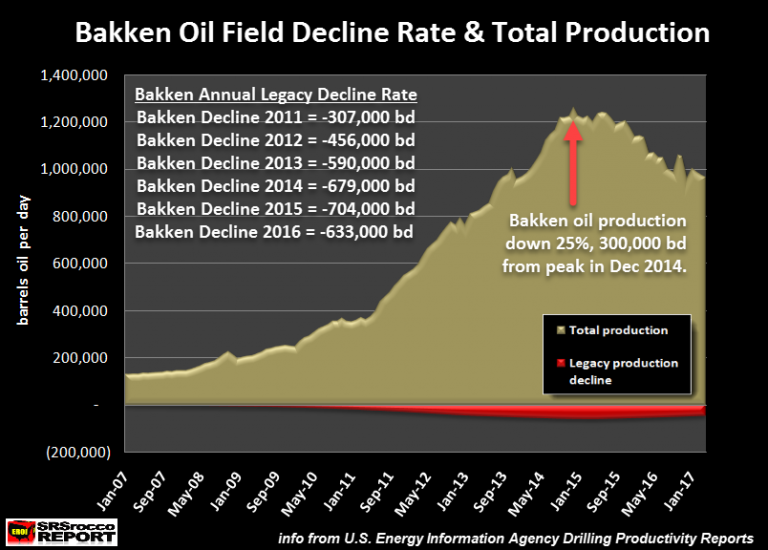
Bakken shale oil production peaked at 1.26 mbd in December 2014 and has fallen 25% to 963,000 barrels per day (bd) currently. The red area at the bottom of the chart is displaying its month legacy production decline. This is how much oil production the Bakken is losing each month. I took these figures and calculated how much oil production the Bakken was losing each year.
In 2011, the Bakken only lost 307,000 bd, but this decline rate surged more than double to 633,000 bd in 2016. Which means, the Bakken lost 633,000 barrels per day of oil last year. Even though the Bakken added 326,000 bd of new production in 2016, its overall production continued to decline.
The same huge declines also took place in the Eagle Ford shale oil field in Texas:
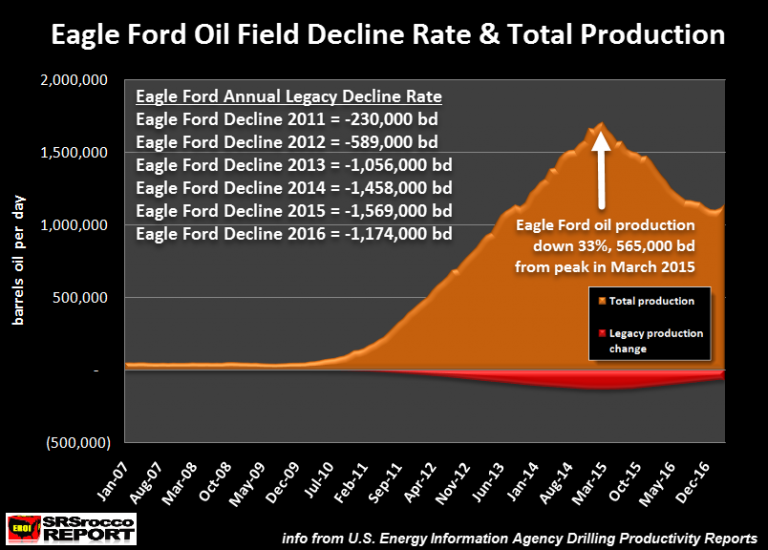
The Eagle Ford oil production peaked in March 2015 at 1.71 mbd and is currently down 33% to 1.14 mbd. You will also notice the the Eagle Ford suffered an annual oil production decline of 1,174,000 bd in 2016. Which is also why the Eagle Ford oil production continued to decline in 2016. The drillers didn’t add enough new oil production to offset the huge declines.
If we look at both the Bakken and Eagle Ford together, this is the result:
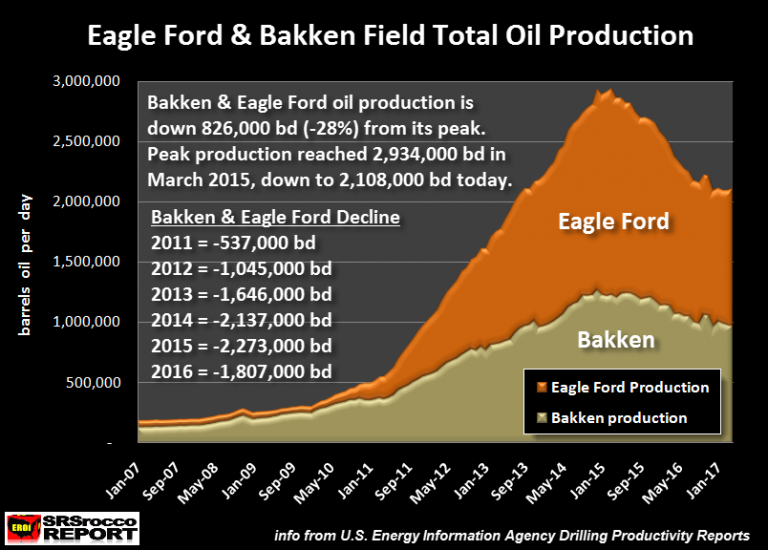
Total Bakken and Eagle Ford oil production has declined by 826,000 bd from their peak. This is a 28% decline in just two years. Furthermore, these two fields suffered an annual decline rate of 1.8 mbd of oil in 2016. That is one heck of a lot of oil production lost forever due to a tremendously high annual decline rate.
Even though overall U.S. oil production has increased from a bottom placed in the middle of 2016, due to higher oil prices, this increase did not come from the Bakken or Eagle Ford fields. As we can see in the chart above, combined oil production has remained flat over the past nine months. This means, the drillers in the Bakken and Eagle Ford haven’t been too motivated by the rising oil price to add enough drilling rigs to increase overall production.
So, where has the overall rise in U.S. oil production come from, if not from the Bakken and Eagle Ford? One place is from the new kid on the block called the Permian region in West Texas. Permian oil production is up a whopping 486,000 bd since the beginning of 2015, accounting for a large percentage of the overall rise in U.S. oil production:
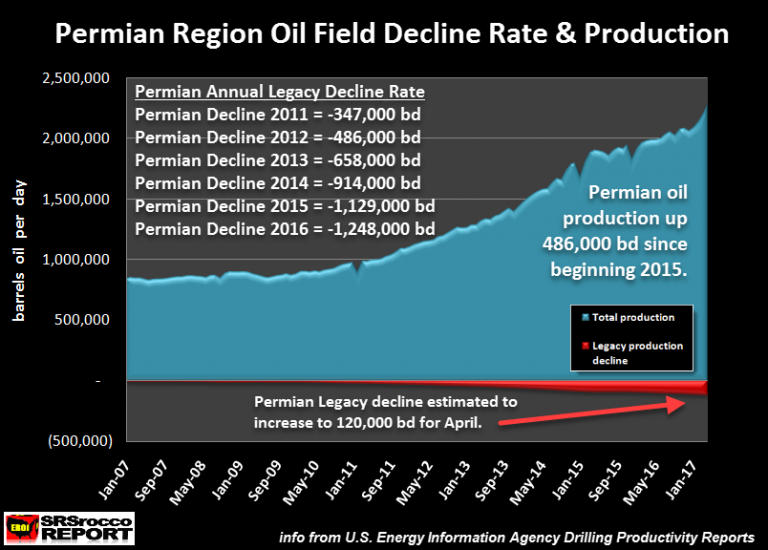
Unfortunately, the Permian’s annual oil decline rate is also increasing steadily. In 2016, it increased to 1,248,000 bd of oil. So, the oil companies drilling in the Permian had to add at least 1,248,000 bd of new production to increase overall production in 2016. Actually, with all the massive drilling, the Permian’s oil production only increased a net 142,000 bd last year.
However, a big increase in Permian oil production has taken place over the past three months this year as the region is the NEW OIL FAD for the U.S. and global oil industry. Major oil companies are jumping in with both feet on the Permian band wagon to continue producing oil. This has caused the Permian’s oil production to increase by a hefty 143,000 barrels from Jan-Mar 2017. That is shown by the big surge up on the right hand side of the chart above.
As overall oil production continues to increase in the Permian, so will its annual decline rate. The Permian will suffer the same fate as the Bakken and Eagle Ford. I highly doubt the Bakken or Eagle Ford will ever again surpass their peak production set back in 2015.
Top 4 U.S. Shale Oil Fields Suffer Massive Annual Decline Rate
If we add up the annual oil production decline rates from the top four shale oil producers in the United States, they lost a stunning 3.4 mbd of oil in 2016:
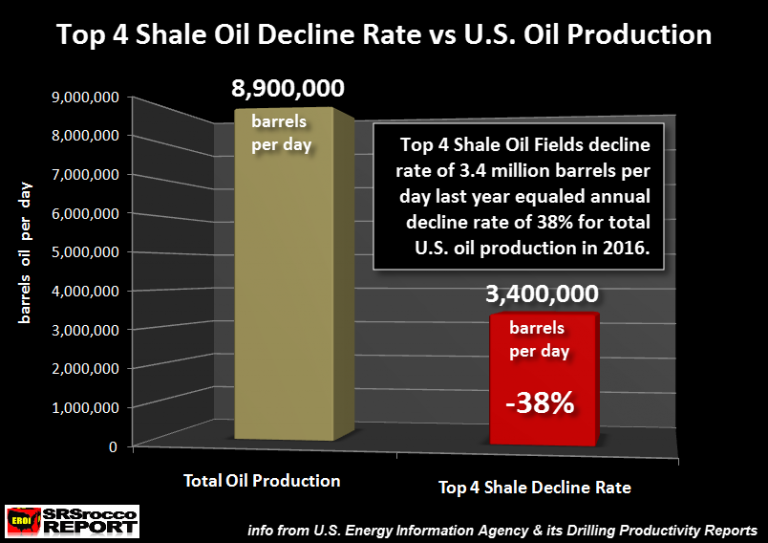
If we add up the annual legacy oil production declines from the Permian, Eagle Ford, Bakken and Niobrara oil fields, it accounted for 38% of total U.S. oil production in 2016. Which means, these four fields lost 38% of total U.S. oil production last year.
Thus, the companies drilling in these four fields had to add at least 3.4 mbd of new oil production just to keep production from declining last year. Furthermore, to keep production from declining in these four oil fields, the companies will have to add another 3 mbd (or more) EACH AND EVERY YEAR. While the decline rate in some of these fields may continue to decline, we can plainly see this is a HUGE TASK.
In keeping with the “U.S. Energy Hype Theme”, the Mainstream media has published articles stating the cost to produce oil in the Permian is now down to $40 a barrel, and could fall to $20. This is pure nonsense. Yes, it is true that some production costs have fallen due to a 50% decline in the price of oil, but that doesn’t change the fact the oil industry continues to be saddled with record amount of debt.
The top 18 U.S. oil companies have seen their long term debt surge from $107 billion in 2008 to $194 billion in 2016. In addition, the low oil price destroyed the financial statements of these oil and gas producers. In 2008, these 18 domestic energy companies enjoyed a stunning $163 billion in positive operation income. Unfortunately, last year was a disaster as they suffered a combined $19 billion operating income loss. Hell, they didn’t have the positive operating income to pay the $6.7 interest on the debt payment.
The only U.S. oil company that posted a positive operating income profit in the group was ExxonMobil (NYSE:XOM). However, after ExxonMobil paid their capital expenditures and shareholder dividends, they were $6.7 billion in the hole last year. Which is part of the reason ExxonMobil’s long term debt has doubled to $34 trillion in the past two years.
Even though domestic shale oil production will continue to increase as investors throw away hard-earned funds, to either break-even or lose money, the U.S. will never become energy independent. Yes, overall production will rise for a while, but when the party is finished, the hangover will be extreme. Who is going to pay to close in these tens of thousands of shale oil and gas wells????
The Falling EROI – Energy Returned On Investment is now seriously gutting the entire U.S. and global oil industry. It is also causing a tremendous amount of havoc in the global economy. Using massive amounts of debt and derivatives to offset the Falling EROI will not last for long.
Sure, the madness could continue for several more years, but we humans live long lives. While the charade could continue for years, it will definitely not last for decades. Thus, watch for disintegration of the U.S. and global oil industries for clues to when the markets will finally crack.
